
Uploaded by
trilby
4 SLIDES
166 VUES
40LIKES
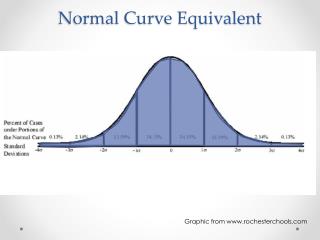
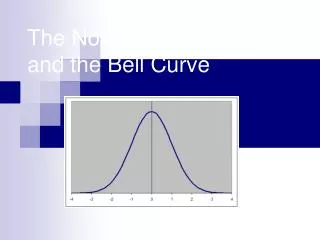
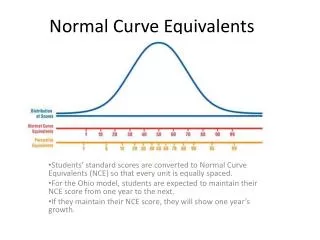
Sampling Distributions Overview: Categorical and Quantitative Data
DESCRIPTION
Understand the normal curve alias for categorical and quantitative data, and learn how X represents successes or actual data. Explore sampling distributions for two possible outcomes and sample means from quantitative data.
Download

1 / 4
Télécharger la présentation 
Sampling Distributions Overview: Categorical and Quantitative Data
An Image/Link below is provided (as is) to download presentation
Download Policy: Content on the Website is provided to you AS IS for your information and personal use and may not be sold / licensed / shared on other websites without getting consent from its author.
Content is provided to you AS IS for your information and personal use only.
Download presentation by click this link.
While downloading, if for some reason you are not able to download a presentation, the publisher may have deleted the file from their server.
During download, if you can't get a presentation, the file might be deleted by the publisher.
E N D
Presentation Transcript
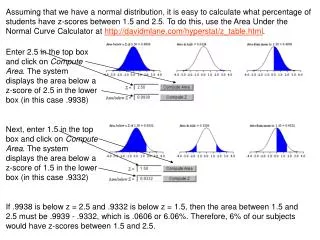
For categorical data, X represents counts – the number of successes. For quantitative data, X represents the actual data. X X X X X X X X X
This distribution consists of all possible sample proportions when the random variable is categorical with only two possible outcomes, S or F.
This distribution contains all possible sample means that could be produced from quantitative data.


More Related