Download
1 / 8
80 likes | 275 Vues
The Standard Normal Curve Revisited. Can you place where you are on a normal distribution at certain percentiles? 50 th percentile? Z = 0 84 th percentile? Z = 1 2.5 percentile? Z = -2. Finding z-scores given the percentile.

E N D
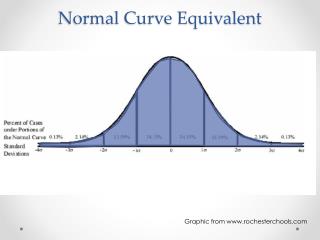
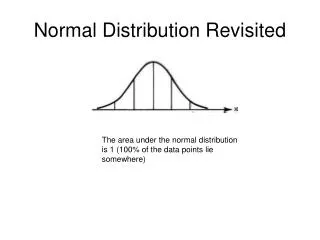
Can you place where you are on a normal distribution at certain percentiles? • 50th percentile? Z = 0 • 84th percentile? Z = 1 • 2.5 percentile? Z = -2
Finding z-scores given the percentile • Find the closest percentile on the table to get the z-score or… • Use the invNorm command to find the z-score given the percentile or area under a normal curve. • Press 2nd, DIST, invNorm (percentile as a decimal #). • For example, to find the z-score for the 75th percentile, press invNorm (.75). • For the standard normal distribution, • What is the median (50%tile)? • invNorm(.50) = 0 • What is the lower quartile? • invNorm(.25) = -.674 • What z -score falls at the 95th percentile? • invNorm (.95) = 1.645 • What z-score has 30% of the data above it? • invNorm(.70) = .524
SAT Example • The approximately normal distribution of SAT scores for the 2009 incoming class at the University of Texas had a mean 1815 and a standard deviation 252. • What did a student at University of Texas get on the SAT if his or her score was 1.6 standard deviations above the average? • Z = 1.6 • 1.6 = x – 1815 252 • 403.2 = x – 1815 • X = 2218.2 or 2218 • What score did a student get who is at the 90th percentile? • Z = invNorm(.90) = 1.28 • 1.28 = x – 1815 252 • 322.56 = x – 1815 • X = 2137.56 or 2138
Heights Example • The heights of 18 to 24 year old males in the US are approximately normal with mean 70.1 inches and standard deviation 2.7 inches. The heights of 18 to 24 year old females have a mean of 64.8 inches and a standard deviation of 2.5 inches. • How tall does a US woman between 18 and 24 have to be to be at the 35th percentile? • Z = invNorm(.35) = -.385 • -.385 = x – 64.8 2.5 • -.9625 = x – 64.8 • X = 63.84 inches • In order to be in the Tall Club of America, you must be in the top 10% height range. What is the cut off for males? For females? • Z = invNorm(.90) = 1.28 1.28 = x – 70.1 1.28 = x – 64.8 2.7 2.5 3.456 = x – 70.1 3.2 = x – 64.8 • x = 73.556 inches x = 68 inches (6’ 1.5” for males) (5’8” for females)
Born to Run • A study of elite distance runners found a mean body weight of 139.1 pounds with a standard deviation of 10.6 pounds. • How much would a runner weigh to be in the 75th percentile? • invNorm(.75) = .67 • .67 = (x – 139.1)/10.6 • X = 146.2 pounds • 40% of the runners weigh more than pounds. • invNorm(.6) = .25 • .25 = (x – 139.1)/10.6 • X = 141.75 pounds
Using z-scores in a Normal Distribution • Find the percent: • find the z-score using the formula • then use the table or normalcdf to find the % • Given the percent: • find the z-score using the table or invNorm • then solve for the observation using the z-score formula Z = observation – mean standard deviation
Reminders • Z – score = standard score = # of standard deviations above or below the mean • A z- score is NOT a percent!