The Normal Curve
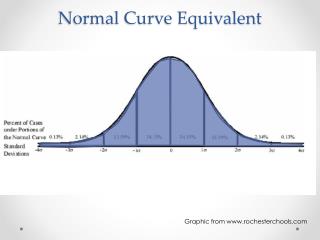
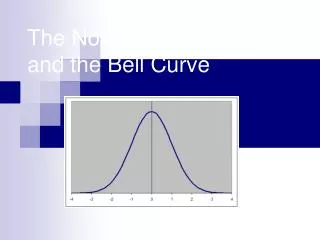
The Normal Curve. Theoretical Symmetrical Known Areas For Each Standard Deviation or Z-score FOR EACH SIDE: 34.13% of scores in distribution are b/t the mean and 1 s from the mean 13.59% of scores are between 1 and 2 s’s from the mean 2.28% of scores are > 2 s’s from the mean.


The Normal Curve
E N D
Presentation Transcript
The Normal Curve • Theoretical • Symmetrical • Known Areas For Each Standard Deviation or Z-score • FOR EACH SIDE: • 34.13% of scores in distribution are b/t the mean and 1 s from the mean • 13.59% of scores are between 1 and 2 s’s from the mean • 2.28% of scores are > 2 s’s from the mean
Xi = 120; X = 100; s=10 Z= 120 – 100 = +2.00 10 Z SCORE FORMULA Z = Xi – X S The point is to convert your particular metric (e.g., height, IQ scores) into the metric of the normal curve (Z-scores). If all of your values were converted to Z-scores, the distribution will have a mean of zero and a standard deviation of one.
Normal Curve Probability • Important Link • Normal curve is limited as most real world data is not “normally distributed” • More important use has to do with probability theory and drawing samples from a population
There are 2 outcomes that are red THERE ARE 10 POSSIBLE OUTCOMES Probability Basics • What is the probability of picking a red marble out of a bowl with 2 red and 8 green? p(red) = 2 divided by 10 p(red) = .20
Frequencies and Probability • The probability of picking a color relates to the frequency of each color in the bowl • 8 green marbles, 2 red marbles, 10 total • p(Green) = .8 p(Red) = .2
Frequencies & Probability • What is the probability of randomly selecting an individual who is extremely liberal from this sample? p(extremely liberal) = 32 = .024 (or 2.4%) 1,319
PROBABILITY & THE NORMAL DISTRIBUTION • We can use the normal curve to estimate the probability of randomly selecting a case between 2 scores • Probability distribution: • Theoretical distribution of all events in a population of events, with the relative frequency of each event
PROBABILITY & THE NORMAL DISTRIBUTION • The probability of a particular outcome is the proportion of times that outcome would occur in a long run of repeated observations. • 68% of cases fall within +/- 1 standard deviation of the mean in the normal curve • The odds (probability) over the long run of obtaining an outcome within a standard deviation of the mean is 68%
Probability & the Normal Distribution • Suppose the mean score on a test is 80, with a standard deviation of 7. If we randomly sample one score from the population, what is the probability that it will be as high or higher than 89? • Z for 89 = 89-80/7 = 9/7 or 1.29 • Area in tail for z of 1.29 = 0.0985 • P(X > 89) = .0985 or 9.85% • ALL WE ARE DOING IS THINKING ABOUT “AREA UNDER CURVE” A BIT DIFFERENTLY (SAME MATH)
Probability & the Normal Distribution • Bottom line: • Normal distribution can also be thought of as probability distribution • Probabilities always range from 0 – 1 • 0 = never happens • 1 = always happens • In between = happens some percent of the time • This is where our interest lies
Inferential Statistics • Inferential statistics are used to generalize from a sample to a population • We seek knowledge about a whole class of similar individuals, objects or events (called a POPULATION) • We observe some of these (called a SAMPLE) • We extend (generalize) our findings to the entire class
WHY SAMPLE? • Why sample? • It’s often not possible to collect info. on all individuals you wish to study • Even if possible, it might not be feasible (e.g., because of time, $, size of group)
WHY USE PROBABILITY SAMPLING? • Representative sample • One that, in the aggregate, closely approximates the population from which it is drawn
PROBABILITY SAMPLING • Samples selected in accord with probability theory, typically involving some random selection mechanism • If everyone in the population has an equal chance of being selected, it is likely that those who are selected will be representative of the whole group • EPSEM – Equal Probability of SElection Method
PARAMETER & STATISTIC • Population • the total membership of a defined class of people, objects, or events • Parameter • the summary description of a given variable in a population • Statistic • the summary description of a variable in a sample (used to estimate a population parameter)
INFERENTIAL STATISTICS • Samples are only estimates of the population • Sample statistics will be slightly off from the true values of its population’s parameters • Sampling error: • The difference between a sample statistic and a population parameter
EXAMPLE OF HOW SAMPLE STATISTICS VARY FROM A POPULATION PARAMETER x=7 x=0 x=3 x=1 x=5 x=8 x=5 x=3 x=8 x=7 x=4 x=6 X=4.0 X=5.5 μ = 4.5 (N=50) x=1 x=7 x=3 x=4 x=5 x=6 CHILDREN’S AGE IN YEARS X=4.3 x=2 x=8 x=4 x=5 x=9 x=4 x=5 x=9 x=3 x=0 x=6 x=5 X=5.3 X=4.7
By Contrast:Nonprobability Sampling • Nonprobability sampling may be more appropriate and practical than probability sampling: • When it is not feasible to include many cases in the sample (e.g., because of cost) • In the early stages of investigating a problem (i.e., when conducting an exploratory study) • It is the only viable means of case selection: • If the population itself contains few cases • If an adequate sampling frame doesn’t exist
Nonprobability Sampling: 2 Examples • CONVENIENCE SAMPLING • When the researcher simply selects a requisite number of cases that are conveniently available • SNOWBALL SAMPLING • Researcher asks interviewed subjects to suggest additional people for interviewing
Probability vs. Nonprobability Sampling:Research Situations • For the following research situations, decide whether a probability or nonprobability sample would be more appropriate: • You plan to conduct research delving into the motivations of serial killers. • You want to estimate the level of support among adult Duluthians for an increase in city taxes to fund more snow plows. • You want to learn the prevalence of alcoholism among the homeless in Duluth.
(Back to Probability Sampling…)The “Catch-22” of Inferential Stats: • When we collect a sample, we know nothing about the population’s distribution of scores • We can calculate the mean (X) & standard deviation (s) of our sample, but and are unknown • The shape of the population distribution (normal?) is also unknown • Exceptions: IQ, height
PROBABILITY SAMPLING • 2 Advantages of probability sampling: • Probability samples are typically more representative than other types of samples • Allow us to apply probability theory • This permits us to estimate the accuracy or representativeness of the sample
SAMPLING DISTRIBUTION • From repeated random sampling, a mathematical description of all possible sampling event outcomes (and the probability of each one) • Permits us to make the link between sample and population… • & answer the question: “What is the probability that sample statistic is due to chance?” • Based on probability theory
Imagine if we did this an infinite amount of times… x=7 x=0 x=3 x=1 x=5 x=8 x=5 x=3 x=8 x=7 x=4 x=6 X=4.0 X=5.5 μ = 4.5 (N=50) x=1 x=7 x=3 x=4 x=5 x=6 CHILDREN’S AGE IN YEARS X=4.3 x=2 x=8 x=4 x=5 x=9 x=4 x=5 x=9 x=3 x=0 x=6 x=5 X=5.3 X=4.7
What would happen…(Probability Theory) • If we kept repeating the samples from the previous slide millions of times? • What would be our most common sample mean? • The population mean • What would the distribution shape be? • Normal • This is the idea of a sampling distribution • Sampling distribution of means
Relationship between Sample, Sampling Distribution & Population • Empirical (exists in reality) but unknown • Nonempirical (theoretical or hypothetical) • Laws of probability allow us • to describe its characteristics • (shape, central tendency, • dispersion) • Empirical & known (distribution shape, mean, standard deviation)
TERMINOLOGY FOR INFERENTIAL STATS • Population • the universe of students at the local college • Sample • 200 students (a subset of the student body) • Parameter • 25% of students (p=.25) reported being Catholic; unknown, but inferred from sample statistic • Statistic • Empirical & known: proportion of sample that is Catholic is 50/200 = p=.25 • Random Sampling (a.k.a. “Probability”) • Ensures EPSEM & allows for use of sampling distribution to estimate pop. parameter (infer from sample to pop.) • Representative • EPSEM gives best chance that the sample statistic will accurately estimate the pop. parameter