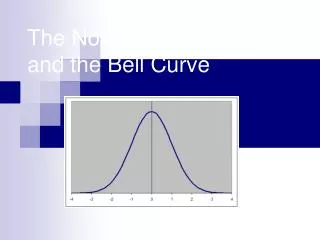
Using the Normal Distribution Curve
60 likes | 102 Vues
Explore the properties of the normal distribution curve with real-life examples of male and female heights in the U.S. Learn how to calculate percentages using standard deviations and Z-scores.

Using the Normal Distribution Curve
E N D
Presentation Transcript
68% of the data fall within 1 standard deviation of the mean 95% of the data fall within 2 standard deviations of the mean 99.7% of the data fall within 3 standard deviations of the mean Properties of the normal distribution curve
example • Suppose the heights (in inches) of males in the United States between the ages 20–29 are normally distributed with a mean of 69.3 inches and a standard deviation of 2.92 inches. Find the percent of males that are shorter than 66.38 inches. • Taller than 72.22 • Between 63.46 and 75.14
Using the normal curve • What if the value you want is not an even standard deviation from the mean? • For example, try this one: • Suppose the heights (in inches) of adult females (ages 20−29) in the United States are normally distributed with a mean of 64.1 inches and a standard deviation of 2.75 inches. Find the percent of women who are no more than 63 inches tall.
Z score • Z score is the data point minus the mean over the standard deviation
Now try it: • Suppose the heights (in inches) of adult females (ages 20−29) in the United States are normally distributed with a mean of 64.1 inches and a standard deviation of 2.75 inches. Find the percent of women who are no more than 63 inches tall. • At least 66 inches tall