The Normal Distribution and the Bell Curve
130 likes | 328 Vues
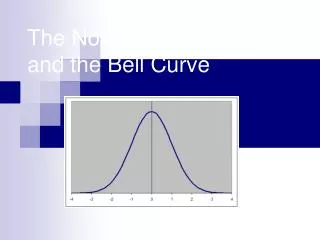
The Normal Distribution and the Bell Curve.

The Normal Distribution and the Bell Curve
E N D
Presentation Transcript
The normal curve is often called the Gaussian distribution, after Carl Friedrich Gauss, who discovered many of its properties. Gauss, commonly viewed as one of the greatest mathematicians of all time (if not the greatest), is properly honored by Germany on their 10 Deutschmark bill:
You will notice the normal curve to his left:Here the formula for the curve has been modified to shift its center to on the x-axis, and to arrange that its inflection points are at - and +. The factor in front arranges that the area under the curve remains equal to 1.
This curve lies entirely above the horizontal axis, and that axis is an asymptote in both horizontal directions (i.e. as x grows large and positive or large and negative, the curve approaches arbitrarily close to the axis, but never reaches it). The area between the curve and the horizontal axis is exactly 1. Note that this is the area of a region that is infinitely wide, since the curve never actually touches the axis.
Examples of Studies which might provide Normal Results • Another example: I test 200 tires from a production run, by wearing them out, to see how many miles they last. I select those 200 at random from the entire production run. I can't test the entire production run (because I can't sell tested, i.e. worn-out tires). Again, my sample may be unrepresentative, but the normal curve will give me a way to estimate the likely margin of error.
Nutrition • Let's say you are writing a story about nutrition. You need to look at people's typical daily calorie consumption. Like most data, the numbers for people's typical consumption probably will turn out to be normally distributed. That is, for most people, their consumption will be close to the mean, while fewer people eat a lot more or a lot less than the mean. • When you think about it, that's just common sense. Not that many people are getting by on a single serving of kelp and rice. Or on eight meals of steak and milkshakes. Most people lie somewhere in between.
If you looked at normally distributed data on a graph, it would look something like this: • The x-axis (the horizontal one) is the value in question... calories consumed, dollars earned or crimes committed, for example. And the y-axis (the vertical one) is the number of data points for each value on the x-axis... in other words, the number of people who eat x calories, the number of households that earn x dollars, or the number of cities with x crimes committed. • Now, not all sets of data will have graphs that look this perfect. Some will have relatively flat curves, others will be pretty steep. Sometimes the mean will lean a little bit to one side or the other. But all normally distributed data will have something like this same "bell curve" shape.
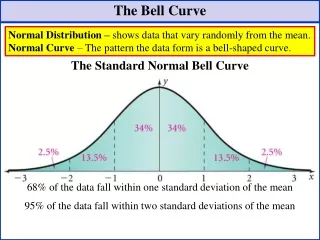
One standard deviation away from the mean in either direction on the horizontal axis (the red area on the above graph) accounts for somewhere around 68 percent of the people in this group. Two standard deviations away from the mean (the red and green areas) account for roughly 95 percent of the people. And three standard deviations (the red, green and blue areas) account for about 99 percent of the people. • If this curve were flatter and more spread out, the standard deviation would have to be larger in order to account for those 68 percent or so of the people. So that's why the standard deviation can tell you how spread out the examples in a set are from the mean.