Download
1 / 16
160 likes | 505 Vues
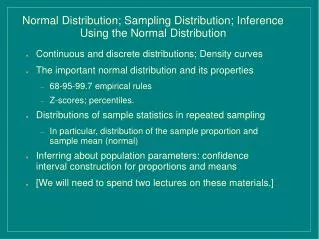
Normal Distribution; Sampling Distribution; Inference Using the Normal Distribution. Continuous and discrete distributions; Density curves The important normal distribution and its properties 68-95-99.7 empirical rules Z-scores; percentiles.

E N D
Normal Distribution; Sampling Distribution; Inference Using the Normal Distribution Continuous and discrete distributions; Density curves The important normal distribution and its properties 68-95-99.7 empirical rules Z-scores; percentiles. Distributions of sample statistics in repeated sampling In particular, distribution of the sample proportion and sample mean (normal) Inferring about population parameters: confidence interval construction for proportions and means [We will need to spend two lectures on these materials.]
Continuous and Discrete Distributions Recall the concept of probability distribution (or probability model) Some distributions are for discrete variables (e.g., coin toss outcome), others for continuous variables (e.g., income or weight data) For discrete distributions, we may list all the possible values of the random variable and the associated probabilities (e.g. coin toss) For continuous distribution this is not possible (why?) We instead describe it with a density curve (corresponding to a density function) The probability of the random variable taking values within any interval is given by the area under the density curve between that interval. (Can we talk about Pr(x=a), a is a single number?) How do probability rules operate for continuous distributions? e.g. “All possible outcomes together must have probability 1” means the total area under the density curve is 1.
The Normal Distribution The normal distribution is the most important type of continuous distribution The distributions of many real world variables (such as weights, heights, and some psychological test scores for a relatively homogeneous group) are approximately normal The distribution of sample mean/proportion is approximately normal, even if the distribution of the population from which the samples are drawn is not normal. This fact is tremendously useful for statistical inference, as we shall see. The normal density curve is symmetric, bell-shaped, uni-modal, and is completely determined by two values: the expectation (or mean) and the standard deviation (defined in similar fashion as standard deviation in observed data)
Knowing the mean and the standard deviation of a normal density curve, we will be able to tell: What is the probability the variable takes any range of values At what percentile is a given value What value corresponds to a given percentile Can use tables or software to find the answers See the normal curve applet: http://www.whfreeman.com/scc7e or this calculator:http://davidmlane.com/hyperstat/z_table.html In particular, we have these useful empirical rules: 68% of the values fall within one standard deviation of the mean 95% of the values fall within two standard deviations of the mean 99.7% of the values fall within three standard deviations of the mean Normal Density Curves
Using the Empirical Rules: Example The distribution of heights of young women aged 18-24 is approximately normal with mean 65in and standard dev. 2.5in.
Using the Empirical Rules: Example The SAT scores follow N(500, 100). Where does Jenny's 600 score stand? (84th percentile)
Standardized Scores (Z scores) There is one normal distribution for each pair of mean/standard deviation, so infinite possible normal distributions. All can be transformed into the “standard normal” distribution, which has mean 0 and standard deviation 1. (Statistical tables are made for this one) If x comes from a normal distribution with mean and standard deviation then Z=(x-)/ comes from the standard normal distribution. Z is called the standardized score, or Z score. It tells us how many standard deviations away the x score is from the mean. e.g. the 600 SAT score has a Z score of (600-500)/100=1: it is one standard deviation above the mean of 500. Use the normal table (such as the one on the next slide) to find the percentile of a given Z score, or the Z score that has a given percentile. Or better, use the calculator online
Using the Z Score: More Examples • Males (ages 18-24) have a mean height of 70 inches and a standard deviation of 2.8 in. Females (ages 18-24) have a mean height of 65 in. and a standard deviation of 2.5 in. What is the standardized score corresponding to your height? What is the percentile? • What height value is the 90th percentile for men aged 18 to 24? X = 70 + Z 2.8 • = 70 + 1.3 2.8 • = 70 + 3.64 = 73.64 • What proportion of men aged 18 to 24 have heights between 65in and 70in? • Z=(65-70)/2.8=-5/2.8=-1.79 --->3.6% below 65in (from the table.) Since 50% is below 70in, the proportion in between is 50%-3.6%=46.4%.
Tells what values a sample statistic (such as sample proportion) takes and how often it takes those values in repeated sampling. i.e., assigns probabilities to the values a statistic can take. These probabilities must satisfy Rules A-D. The sample statistic can take on many values in repeated sampling, so sampling distribution typically described by continuous distributions such as the normal. Probability of the sample statistic falling in a given interval of values determined by the area under the density curve between the interval. Often this density curve is a normal curve So can apply the “68-95-99.7 rule” or any other tricks we've learned about the normal distribution It is proven that sample proportions and sample means are approximately normally distributed. Sampling Distribution
Sampling Distribution for Proportion Who Voted • 61.7% of registered voters actually voted in the 2008 presidential election. • In a random sample of 1600 voters, the proportion who claimed to have voted was 63.7% • Such sample proportions from repeated sampling would have a normal distribution with mean .617 and standard deviation .012 • What is the probability of observing a sample proportion as large or larger than .637? Z=(.637 - .617) / .012 = 1.67 From normal table, this corresponds to about 95% percentile. So only about 5% chance that observe sample proportion larger than .637.