Download
1 / 27
300 likes | 1.22k Vues
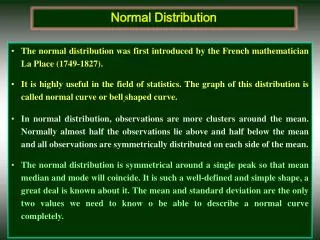
z Scores & the Normal Curve Model. The normal distribution and standard deviations. The normal distribution and standard deviations. In a normal distribution:. Approximately 68% of scores will fall within one standard deviation of the mean. The normal distribution and standard deviations.

E N D
The normal distribution and standard deviations In a normal distribution: Approximately 68% of scores will fall within one standard deviation of the mean
The normal distribution and standard deviations In a normal distribution: Approximately 95% of scores will fall within two standard deviations of the mean
The normal distribution and standard deviations In a normal distribution: Approximately 99% of scores will fall within three standard deviations of the mean
Using standard deviation units to describe individual scores Here is a distribution with a mean of 100 and and standard deviation of 10: 80 90 100 110 120 -2 sd -1 sd 1 sd 2 sd What score is one sd below the mean? 90 120 What score is two sd above the mean?
Using standard deviation units to describe individual scores Here is a distribution with a mean of 100 and and standard deviation of 10: 80 90 100 110 120 -2 sd -1 sd 1 sd 2 sd 1 How many standard deviations below the mean is a score of 90? How many standard deviations above the mean is a score of 120? 2
z scores are sometimes called standard scores Here is the formula for a z score: Z scores A z score is a raw score expressed in standard deviation units. What is a z-score?
Computational Formula • z = (X – M)/SX • Score minus the mean divided by the standard deviation • Different formula for the population
Using z scores to compare two raw scores from different distributions You score 80/100 on a statistics test and your friend also scores 80/100 on their test in another section. Hey congratulations you friend says—we are both doing equally well in statistics. What do you need to know if the two scores are equivalent? the mean? What if the mean of both tests was 75? You also need to know the standard deviation What would you say about the two test scores if the S in your class was 5 and the S in your friends class is 10?
Calculating z scores What is the z score for your test: raw score = 80; mean = 75, S = 5? What is the z score of your friend’s test: raw score = 80; mean = 75, S = 10? Who do you think did better on their test? Why do you think this?
Why z-scores? • Transforming scores in order to make comparisons, especially when using different scales • Gives information about the relative standing of a score in relation to the characteristics of the sample or population • Location relative to mean • Relative frequency and percentile • Slug, Binky and Biff example p 133
What does it tell us? • z-score describes the location of the raw score in terms of distance from the mean, measured in standard deviations • Gives us information about the location of that score relative to the “average” deviation of all scores
Fun facts about z scores • Any distribution of raw scores can be converted to a distribution of z scores the mean of a distribution has a z score of ____? zero positive z scores represent raw scores that are __________ (above or below) the mean? above negative z scores represent raw scores that are __________ (above or below) the mean? below
Computing Raw Score when Know z-score • X = (z) (SX) + M
Z-score Distribution • Mean of zero • Zero distance from the mean • Standard deviation of 1 • The z-score has two parts: • The number • The sign • Negative z-scores aren’t bad • Z-score distribution always has same shape as raw score
Uses of the z-score • Comparing scores from different distributions • Interpreting individual scores • Describing and interpreting sample means
Comparing Different Variables • Standardizes different scores • Example in text: • Statistics versus English test performance • Can plot different distributions on same graph • increased height reflects larger N
Determining Relative Frequency • Proportion of time a score occurs • Area under the curve • The negative z-scores have a relative frequency of .50 • The positive z-scores have a relative frequency of .50 • 68% scores +/- 1 z-score
The Standard Normal Curve • Theoretically perfect normal curve • Use to determine the relative frequency of z-scores and raw scores • Proportion of the area under the curve is the relative frequency of the z-score • Rarely have z-scores greater than 3 (.26% of scores above 3, 99.74% between +/- 3)
Application of Normal Curve Model • Can determine the proportion of scores between the mean and a particular score • Can determine the number of people within a particular range of scores by multiplying the proportion by N • Can determine percentile rank • Can determine raw score given the percentile
Using the z-Table • Important when dealing with decimal z-scores • Table I of Appendix B (p. 488 – 491) • Gives information about the area between the mean and the z and the area beyond z in the tail • Use z-scores to define psychological attributes
Using z-scores to Describe Sample Means • Useful for evaluating the sample and for inferential statistical procedures • Evaluate the sample mean’s relative standing • Sampling distribution of means could be created by plotting all possible means with that sample size and is always approximately a normal distribution • Sometimes the mean will be higher, sometimes lower • The mean of the sampling distribution always equals the mean of the underlying raw scores of the population (most of the means will be around )
Central Limit Theorem • Used for creating a theoretical sampling distribution • A statistical principle that defines the mean as equal to , SD that is equal to , and the shape of the distribution which is approximately normal • Obtain information without having to actually sample the population • Interpretation is the same: if close to mean occurs more frequently • Compute z-scores to indicate relative frequency of the sample mean
Standard Error of the Mean • Average amount that the sample means deviate from the • Population standard error: • M = X/square root of N • Larger N produces more representative samples • Determine on average how much the means differ from the
Calculating z-score for sample mean • Z = (M - )/M • Determine relative frequency of sample means • Use the standard normal curve and z-tables to describe relative frequency of sample means • Interpretation is identical: larger the z, the smaller the relative frequency