normal curve
normal curve. Mrs. Aldous, Mr. Beetz & Mr. Thauvette DP SL Mathematics. Normal Distribution. You should be able to…. Describe the properties of a normal distribution with mean and standard deviation Calculate normal probabilities


normal curve
E N D
Presentation Transcript
normal curve Mrs. Aldous, Mr. Beetz & Mr. ThauvetteDP SL Mathematics
You should be able to… • Describe the properties of a normal distribution with mean and standard deviation • Calculate normal probabilities • Find the corresponding standardized value (z – score) given a probability
You should be able to… • Use the relation to standardize data or to find missing parameters and/or when given probabilities • Use the GDC to find normal probabilities or standardized values.
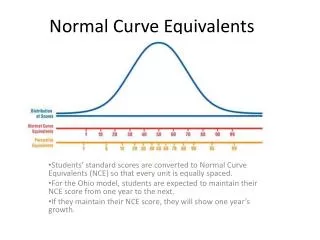
What is normal distribution? The Normal Distribution: A probability distribution where the mean, median, and mode are at the centre of the spread. Mean, median, and mode heights and mass of people Are these normally distributed? IQ scores Scores in an examination lifetime of a battery
Notation for normal distribution The distribution of X is normally distributed with a mean of and a variance of . Note the variance is often the written as the standard deviation squared. Write down the mean and standard deviation of each of the following normal distributions.
Heights of UK Adults Write probability distributions to describe the heights of men and women. Does it matter if you use feet and inches, only inches, or centimeters?
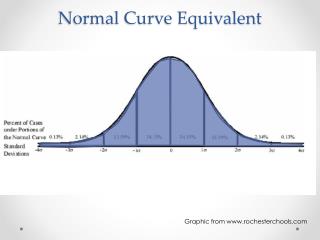
Standardizing data For the normal distribution we can standardize the data. All standardized data has a mean of 0, and a variance (and standard deviation) of 1. Each 1 unit away from the mean is a standard deviation. The standardized values are called z numbers. The area under this curve is 1. -1 0 1
Using a GDC for standardized data If you are able to use a GDC for finding normal values then this is an easy and quick method. 1. Draw a sketch. 2. Use DISTR > normalcdf(. 3. Enter lower and upper bounds. Use -1E99 or 1E99 for . 4. Leave the mean as 1 and the standard deviation as 0. What is the probability that z is less than (or equal to) 1? P(z<1.0) = ? Probability = 0.841 1
Using your GDC Use your GDC to find each of the following. 1. P (z<1.5) 2. P (z>0.85) 3. P (z>-1.21) 4. P (z<-1.75) 5. P (-1<z<1.5) 0.933 0.198 0.887 0.0401 0.775
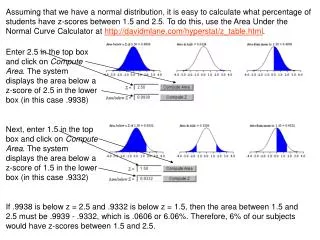
Standardizing real data Before using the normal function, data must be standardized. The formula for this is: Example: The IQ of a population is distributed normally with a mean of 100 and a standard deviation of 12. Calculate the probability that a person picked at random has an IQ greater than 118. Always draw a diagram, and shade the region you require. Write down the ‘real’ values. Standardize your values. The mean will always be 0. Standardize the 118. 100 118 0 1.5 Probability = 0.0668 Use your GDC to find z>1.5 .
Using a GDC with data Example The IQ of a population is distributed normally with a mean of 100 and a standard deviation of 12. Calculate the probability that a person picked at random has an IQ greater than 118. A GDC makes this much easier. Always draw a diagram, shade what you want and put down the ‘real’ values. Probability = 0.0668
Question 1 Always draw a diagram. It can get you method marks. 1. IQs are normally distributed with a mean of 100 and a standard deviation of 14. Calculate the probability that a person picked at random has: a) an IQ greater than 110, b) an IQ lower than 95, c) an IQ between 90 and 108. 0.238 0.360 0.479 2. Scores for a test of anxiety are normally distributed with a mean of 58% and a variance of 225%. Find the probability that a random student scores: a) more than 75% b) less than 60%, c) between 48% and 62%. 0.129 0.553 0.353
Working backwards Example: Scores in an military entrance exam are normally distributed with a mean of 50 and a standard deviation of 20. The mark for an A is to be set such that only 10% of the candidates will score an A. Find the mark required to obtain an A. Draw a diagram and show what is required. Fill in the z values. 90%=0.9 10%=0.1 Shaded area is 0.1. Unshaded area is 0.9. Use DISTR > invNorm(. 50 x ? 0 z
Working backwards continued 0 1.28 z
Working backwards with a GDC Example: Scores in an military entrance exam are normally distributed with a mean of 50 and a standard deviation of 20. The mark for an A is to be set such that only 10% of the candidates will score an A. Find the mark required to obtain an A. You should use your GDC, but always draw a diagram. The diagram counts as “method” for method marks.
Question 2 Always draw a diagram then use your GDC. 1. IQs are normally distributed with a mean of 100 and a standard deviation of 14. Only 1% of the population are classed as ‘genius’. Find the IQ of a genius. 2. A maths exam scores are normally distributed with a mean of 56% and a standard deviation of 13. A C is set so that 40% of the cohort obtain a C. The C is symmetrical about the mean such that the lower mark us 56-a, and the upper mark is 56+a. Find the bounds within which a C is given.
You have been given a normal probability distribution sketch. Make up a question that corresponds to the sketch. You may have to provide some extra information. • Please do not write on the cards. • Pair up with another student and solve each other’s questions. • Continue by meeting other students.
Quiz-quiz-trade • Work on the card you have been given. • Then get up and find another student. Work together on your questions, then trade. • Continue to quiz, quiz, and trade with other students.
How do I approach this question? • What are the key areas from the syllabus?
Example The heights of boys at a particular school follow a normal distribution with a standard deviation of 5 cm. The probability of a boy being shorter than 153 cm is 0.705. (a) Calculate the mean height of the boys.
Example continued… (a) Calculate the mean height of the boys.
Example continued… (b) Write down the probability of a boy being taller than 156 cm.
You should know… • The normal distribution is an example of a continuous probability distribution • We write to refer to a random variable that is normally distributed with parameters and , where is the mean of the data and is the variance
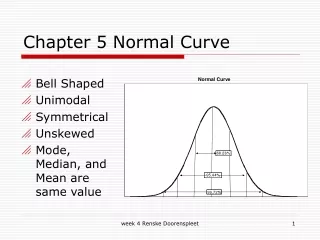
You should know… • The normal curve has the following properties: • Bell-shaped, as most of the data are clustered about the mean • Reaches its maximum height at the mean • Mean, median and mode are all equal • Curve is symmetrical about the mean • Area under the normal curve represents probability, so the total area under the curve is 1
You should know… • Normally distributed data can be standardized using the relation , and the result can be compared to the standard normal distribution with mean of 0 and standard deviation of 1 • The z – score or standard score gives the number of standard deviations from the mean • You can use your GDC to find probabilities and values with or without standardizing first
Be prepared… • Do not confuse probabilities with z – scores when using the standardizing relation. • When solving problems, use a sketch or a normal curve with a shaded area indicating the probability to be given. • Problem can often be solved using the symmetry of the normal curve.
You should be able to… • Recognize and describe a binomial experiment • Determine the probability distribution of a binomial experiment • Calculate the probability of r successes in n trials • Calculate cumulative binomial probabilities • Calculate the mean (expected value) and variance of a binomial distribution
The binomial distribution A binomial distribution is one where there are only two distinct outcomes. Which of the following are binomial? Picking a female student from a group of students. Scoring a goal in a penalty shoot-out? Binomial Student scores in a test. Points scored when a shot is taken in basketball. Tossing a coin. Rolling a die.
Binomial distributions A die is rolled and a ‘success’ is noted as obtaining a square number. The process is repeated 3 times. a) Calculate the probability of obtaining a square when a die is rolled. b) Calculate the probability of obtaining 3 square numbers. c) Calculate the probability of obtaining 0 square numbers. d) Calculate the probability of obtaining 1 square number.
Pascal revisited A die is rolled and a ‘success’ is noted as obtaining a square number. The process is repeated 5 times. Write down the number of ways of obtaining, a) 0 squares, FFFFF 1 SFFFF, FSFFF, FFSFF, FFFSF, FFFFS b) 1 square, 5 SSFFF, SFSFF, SFFSF, SFFFS, FSSFF, FSFSF, FSFFS, FFSSF, FFSFS, FFFSS c) 2 squares, 10 SSSFF, SSFSF, SSFFS, SFSSF, SFSFS, SFFSS, FSSSF, FSSFS, FSFSS, FFSSS 10 d) 3 squares, SSSSF, SSSFS, SSFSS, SFSSS, FSSSS e) 4 squares, 5 f) 5 squares, SSSSS 1 Do you recognize the pattern in the yellow boxes?
Pascal’s triangle A die is rolled and a ‘success’ is noted as obtaining a square number. The process is repeated 5 times. Write down the number of ways of obtaining, 1 1 1 1 2 1 1 3 3 1 1 4 6 4 1 1 5 10 10 5 1 1 6 15 20 15 6 1 5 trials Using a GDC:
5 trials A die is rolled and a ‘success’ is noted as obtaining a square number. The process is repeated 5 times. Find the probability of obtaining, a) 0 squares, b) 2 squares, 2 squares from 5 probability of 2 squares probability 3 non-squares c) 4 squares,
10 trials A die is rolled and a ‘success’ is noted as obtaining a square number. The process is repeated 10 times. Find the probability of obtaining, a) 0 squares, b) 2 squares, c) 5 squares, d) at least 2 squares.
Notation A die is rolled and a “success”is noted as obtaining a square number. The process is repeated 10 times. We can write this as: number of trials, n probability of a success, p In general: The expected result (mean) is denoted by: E(x)=np
Questions 1. The probability of seeing a gecko on a given day is known to be 0.6, and independent. A man walks each day for a week. Find the probability that he sees a gecko: 0.194 a) on 3 separate days, b) on exactly 5 days, 0.261 c) at least 1 day. 0.998 2. A random variable is distributed binomially such that, a) find the expected value of x. b) find the probability that x=3. 0.104 c) find the probability that x>2. 0.135
Probability Tarsia Puzzle You need the information sheet and a set of 24 triangles.
Example A factory makes calculators. Over a long period, 2% of them are found to be faulty. A random sample of 100 calculators is tested. (a) Write down the expected number of faulty calculators in the sample. (b) Find the probability that three calculators are faulty.
Example continued… (b) Find the probability that three calculators are faulty.
Example continued… (c) Find the probability that more than three calculators are faulty.
Example continued… Using the GDC (c) Find the probability that more than three calculators are faulty.