Download
1 / 76
760 likes | 1.31k Vues
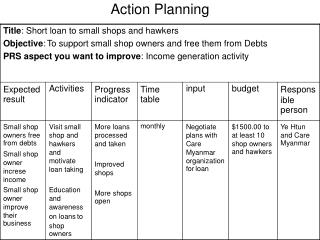
Effective Action Planning within the BOQ Framework Susan Barrett sbarrett@pbismaryland.org www.pbis.org Systems Perspective Organization do not “behave” … individuals behave “Organization is group of individuals who behave together to achieve a common goal ”

E N D
Effective Action Planning within the BOQ Framework Susan Barrett sbarrett@pbismaryland.org
Systems Perspective Organization do not “behave” …individuals behave “Organization is group of individuals who behave together to achieve a common goal” “Systems are needed to support collective use of best practices by individuals in an organization” (Horner, 2001) Schools as Systems Goal to create communities that for all its members have common Vision Language, & Experience Biglan, 1995; Horner, 2002 Adopt systems perspective at a Building Level
What a Leadership Team does… • Communicates common vision for schoolwide supports • Works collaboratively to establish building capacity to support all students • Commits resources to establish procedures for support • Develops methods for evaluating progress towards measureable outcomes • Action planning based on data
Should get easier for your school over time • Handbook • Describes core features • Expectations and teaching matrix (rules for settings) • Teaching plans and teaching schedule • Acknowledgement system • Continuum of consequences for problem behavior • Building Leadership Team • Regular meeting schedule and process • Regular schedule for annual planning and training • Annual Calendar of Activities • On-going support for staff
Using the PBIS Maryland site as a reference • School Examples • Cost Benefit • Other tools, presentations, updated materials • Updated Materials- How many team members and staff have gone to New Team? • Have you seen new training materials? • Tier 1 now includes Classroom Systems ! • Workbook is posted
Purpose of Systems Measures • BOQ Implementation Checklist • Evaluates status of Tier I Positive Behavior Supports • Submitted online at www.pbssurveys.org • Self-Assessment Survey • Evaluates status of Schoolwide, Nonclassroom, Classroom and Individual Student Supports • Submitted online at www.pbssurveys.org
What is the Self-Assessment Survey? • Self-assessment survey to assess the extent to which Positive Behavior Support practices and systems are in place within a school • School-wide (15 items) • Non-classroom (Specific Setting) (9 items) • Classroom (11 items) • Individual Student (8 items)
Who Completes the Self-Assessment Survey? • Initially, the entire staff in a school completes the Survey. • In subsequent years and as an on-going assessment and planning tool, the Survey can be completed in several ways: • All staff at a staff meeting. • Individuals from a representative group. • Team member-led focus group.
Using the Self-Assessment Information for Decision Making • Is a system in place? • “in place” > 66% • Is there a need to focus on a system? • Current status of “in place” is < 66% and • Priority for improvement is “High” for > 50% • Which system should receive focus first? • Always establish schoolwide as first priority • Which features of the system need attention? • Combine survey outcomes with information on office referrals, attendance, suspensions, vandalism, perceptions of staff/faculty
Individual Summary Charts • Charts are provided for each system (school-wide, nonclassroom, classroom, and individual) • Current status Charts • Percentage of respondents who answered "In Place", "Partially In Place", and "Not In Place" • Improvement Priority Charts • Percentage of respondents who answered "High", "Medium", and "Low”
Example of PBS Self Assessment Survey Individual Summaries Chart
Analysis of Schoolwide System Chart Shows a chart with bars for components of the schoolwide system • Expectations defined (question 1) • Expectations taught (question 2) • Reward system (question 3) • Violations system (question 4-8) • Monitoring (question 10-12) • Management (question 9, 14-16) • District support (question 17-18)
Example of PBS Self Assessment Survey Individual Item Score Schoolwide Component White = In Place Yellow = Partial In Place Red = Not In Place
Why conduct Self-Assessment Survey in addition to Checklists? • Checklists are conducted by team, all/most staff complete survey • Look for areas of convergence across tools • Increases confidence of data • Look for areas of divergence across tools • Decrease confidence of data? • Possible reasons for disparity… • Lack of understanding of questions • Staff not fully aware of work of Building Leadership Team • Support component not fully “In Place”
Differences between the BOQ Implementation Checklist and the Self-Assessment Survey
Reviewing Student Measures Answer the “Big Five” questions • How often are problem behavior events occurring? • Where are they happening? • What types of problem behaviors? • When are the problems occurring? • Who is contributing? Using SWIS “Big Five” reports • Major Discipline Referrals per Day per Month • Major Discipline Referrals by Location • Major Discipline Referrals by Problem Behavior • Major Discipline Referrals by Time • Major Discipline Referrals by Student
Langley Elementary School: 478 Students, Grades K-5 Problem Identification (look at Major Discipline Referral per Day per Month on next slide) • Is there a problem with the absolute standard? 478 ✔ .34 4.78 1.63 4.78 100 PROBLEM- ODRs per day higher than national avg.
Langley Elementary School: 478 Students, Grades K-5 Problem Identification (look at Major Discipline Referral per Day per Month on next slide) • Is there a problem with the absolute standard? • Are there trends or patterns? 478 ✔ .34 4.78 1.63 4.78 PROBLEM- ODRs per day higher than national avg. TREND- 4 consecutive mos. of increasing trend
PROBLEM- ODRs per day higher than national avg. TREND- 4 consecutive mos. of increasing trend Happening mostly on the playground Tardiness a problem Disrespect also a problem Happening during morning and lunch recess periods About 3% of students with 2 or more ODRs, 12 students with 5 or more ODRs, 5 students with >30 ODRs
Using Data to Build Solutions • Prevention: How can we avoid the problem context? • Who, When, Where • Schedule change, curriculum change, etc • Teaching: How can we define, teach, and monitor what we want? • Teach appropriate behavior • Use problem behavior as negative example • Recognition: How can we build in systematic reward for desired behavior? • Extinction: How can we prevent problem behavior from being rewarded? • Consequences: What are efficient, consistent consequences for problem behavior? • How will we collect and use data to evaluate (a) implementation fidelity, and (b) impact on student outcomes?
Next Steps • Next year… • Continue to gather and act on behavior and reading data • Three data review sessions • Focus on strengthening Universal Support Systems • Training on Secondary and Intensive Level Supports
Scaling Up SW PBS ImplementationDifferent Journeys to the Same Destination March 26, 2010 Don Kincaid Heather George Lucille Eber Susan Barrett
2 – 4 Years Phases of Implementation • Exploration • Installation • Initial Implementation • Full Implementation • Innovation • Sustainability Fixsen, Naoom, Blase, Friedman, & Wallace, 2005
Exploration Stage Need for change identified, possible solutions are explored, learning about what it takes to implement the innovation effectively, stakeholders are identified and developed, and decision is made to move forward Installation Resources needed to implement innovation with fidelity and desired outcomes are in place Initial Implementation Innovation is in place in schools, implementation largely guided by external TA providers Full Implementation- Innovation is implemented and sustained by local stakeholders and is well-integrated into policy/written documentation Innovation and Sustainability Innovation is adapted to fit local context, innovation becomes more efficient and is integrated with other initiatives
Getting StartedCommitment to School Level Implementation Will this work here? • Establish Local Sites in Multiple Districts • Small and Large • Urban, Suburban and Rural • ES, MS, HS, Alt, JJ
Initial Implementation • Commitment to Capacity Building • Demonstrated High Fidelity/High Impact • Demand Increases • State Team won’t be able to keep up with demand
Features • Point of Contact and Coaches become Local Coordinators • Transfer role to local person • Use phase of implementation to guide decision points • Meet with local team to build action plan- model after state team
Full Implementation • Commitment to Large Scale Implementation • Large number of schools in each district • Sustain and Build Integrated Systems Model- Braiding Initiatives • Shelf Life • Increased roles and duties within District
Innovation and Sustainability • Innovation and Integration • Demonstrated impact throughout • Change/Adapt to fit culture every year • Renew Commitment • Easier, More Efficient, Cost Reduces • Organizational Framework allows for integration • Educators as better consumers
Implementers Blueprint • Self Assessment • More like guidelines • Provides a common language
You have knowledge about the Blueprint • State/District will be successful if: • They start with sufficient resources and commitment • They focus on the smallest changes that will result in the biggest difference • They have a clear action plan • They use on-going self-assessment to determine if they are achieving their plan • They have access to an external agent/coach who is supportive, knowledgeable and persistent.
SWPBS Implementers’ Blueprint Leadership Team • Representation from key stakeholders • Meet regularly with a regular process • Complete regular self-assessment and long term action planning • Led by Coordinator with FTE
SWPBS Implementers’ Blueprint Political Support Funding Visibility Policy • SW PBS Policy statement • developed and endorsed • Implementation data • and outcomes are • reviewed semi-annually • Audit of effectiveness • of existing related • initiatives • conducted annually • Presentations to: • school boards, • state departments • Write into policy • Connect with key • administrators • Disseminate results • to multiple audiences • Websites • Newsletters • Conferences • Media (TV, etc.) • Identify recurring • funding sources • 3 to 5 yrs. of support LEADERSHIP ACTIVITIES
Funding Visibility Policy Political SupportExploration * Installation * Initial Implementation * Full ImplementationInnovation and Sustainability • How have these features evolved over time?
SWPBS Implementers’ Blueprint • BUILD CAPACITY • (training expertise) • Support coaches • Ensure coaches • implement with • fidelity • Establish community • of learning • BUILD CAPACITY • (implementation • expertise) • Support school • teams • Ensure teams • implement with • fidelity • DATA-BASED • DECISION MAKING • Create data systems • Fidelity • Student outcomes • Design process for • evaluation • Establish eval cycles Evaluation Training Coaching Behavioral Expertise COORDINATION ACTIVITIES
Training Coaching EvaluationExploration * Installation * Initial Implementation * Full ImplementationInnovation and Sustainability • How has the Training evolved over time? • How has Coaching evolved over time? • How has evaluation evolved over time?
How did they do that? Florida Illinois Maryland • Similarities ? 10 years, funding provided by state department but “housed” outside department of ed, over 600 schools trained Recognition Program
PBIS Maryland Susan Barrett sbarrett@pbismaryland.org www.pbismaryland.org 1999-2010
Successes/Serendipity • State- Non Profit- University Partnership • Protected FTE • Student Services and Special Education • School Psych Conference • Prior Relationship in each LSS • Small, functional state team • Successful Demo Sites • Willing to talk to anyone who would listen
PBIS Maryland Infrastructure Commitment of leadership at State, District and School levels Private, Public, University partnership Implementation Standards and Protocols developed and implemented INFRASTRUCTURE developed to support State and Regional Training Capacity State-wide impact: 741 schools in all 24 systems trained 660 implementing Tier 1/Universal PBIS with fidelity. Over 100 in initial Tier 2 cohort. PBIS Maryland WEBSITE and DATABASE (www.pbismaryland.org)