Problem 1: Relationship between Two Variables-1 (1)
200 likes | 491 Vues
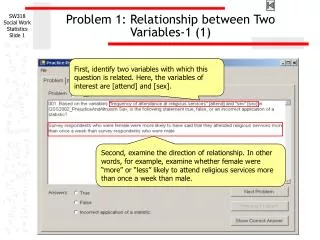
Problem 1: Relationship between Two Variables-1 (1). First, identify two variables with which this question is related. Here, the variables of interest are [attend] and [sex]. .

Problem 1: Relationship between Two Variables-1 (1)
E N D
Presentation Transcript
Problem 1: Relationship between Two Variables-1 (1) First, identify two variables with which this question is related. Here, the variables of interest are [attend] and [sex]. Second, examine the direction of relationship. In other words, for example, examine whether female were “more” or “less” likely to attend religious services more than once a week than male.
Problem 1: Relationship between Two Variables-1 (2) Furthermore, by now, you should be able to identify that [sex] is an independent variable and [attend] is a dependent variable in this statement. Now, let’s explore how to answer this question using SPSS.
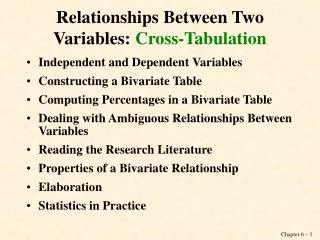
Cross Tabulation in SPSS-1 (1) Recall that the cross tabulation is a way to examine the relationship between two variables. In SPSS, you can get a cross tabulation in Analyze > Descriptive Statistics > Crosstabs… In other words, click on Analyze in the menu bar, select Descriptive Statistics, then Crosstabs…
Cross Tabulation in SPSS-1 (2) In the Crosstabs window, find and move the independent and dependent variable to Column(s): and Row(s): boxes, respectively. In this case, the independent variable [sex] goes to Column(s): box and the dependent variable [attend] goes to Row(s): box.
Cross Tabulation in SPSS-1 (3) Next, click on the Cells… button to get percentage values for each cell in the cross tabulation.
Cross Tabulation in SPSS-1 (4) In the Cell Display window, select the Column in the Percentages section. It allows you to have percentage value separately calculated for each category of the independent variable. Make sure that Observed was selected in the Counts section although it should be checked by default. Click on Continue and OK buttons to see the cross tabulation.
Cross Tabulation in SPSS-1 (5) The output displays two tables, one for case processing summary and the other for cross tabulation of the two variables. Notice that [sex] is on the column and [attend] is on the row of the cross tabulation as we assigned.
Cross Tabulation in SPSS-1 (6) Also notice that the percentage values were calculated by column (i.e., [sex]). For example, the percentage value on the row labeled “8 MORE THAN ONCE WK”, “% within RESPONDENTS SEX”, in the column labeled “1 MALE” was obtained with the count of the cell (18) divided by the count of the males (291) (i.e. 18/291=6.2%). In other words, 6.2% of male respondents said that they attended religious services more than once a week.
Cross Tabulation in SPSS-1 (7) While 6.2% of male respondents, or 18 out of 291 males, said that they attended religious services more than once a week, 9.3% of female respondents, or 35 out of 375 females, said that they attended religious services more than once a week. Thus, we can conclude that female respondents were more likely to have said that they attended religious services more than once a week than male.
Cross Tabulation in SPSS-1 (8) Using the frequency for each category (i.e., male, female) to compare the likelihood of a specific answer can be misleading. At the row labeled “0 NEVER”, for example, more female respondents (56) said that they have never attended religious services than males (53), which sounds true when we simply look at the counts. However, when we compare the % within respondents’ sex the relationship becomes reverse and males (18.2%) are more likely to say that they have never attended religious services than females (14.9%).
Problem 2: Relationship between Two Variables-2 This question is asking whether there is a relationship between [sex] and [ethimp]. Again, you have to know that [sex] is an independent variable and [ethimp] is a dependent variable here.
Cross Tabulation in SPSS-2 (1) Recall that you can get a cross tabulation in Analyze > Descriptive Statistics > Crosstabs… In other words, click on Analyze in the menu bar, select Descriptive Statistics, then Crosstabs…
Cross Tabulation in SPSS-2 (2) First, in the Crosstabs window, find and move the independent variable [sex] to Column(s): box and the dependent variable [ethimp] to Row(s): box. Next, click Cells… button and select Columns in Percentages section.
Cross Tabulation in SPSS-2 (3) Make sure that Observed in Counts section and Column in Percentages section were selected. Then click Continue and OK buttons to get the crosstab.
Cross Tabulation in SPSS-2 (4) We can say that a relationship exists between two variables in a bivariate table if the groups defined by the independent variable have differences of 10% or more in the categories of the dependent variable. In this case, the largest difference in the column percentages for survey respondents in the categories of "importance of ethnic identity" when compared across the groups defined by "sex" (male and female) was that of “3 Moderately Important”, which was 3.5% (=28.0-24.5). Thus no relationship exists between two variables.
Problem 3: Relationship between Two Variables-3 (1) This question asks about how much is the relationship between the two variables. Notice that the dependent variable in this question is [ethtrads] and the independent variable is [sex].
Cross Tabulation in SPSS-3 (1) The cross tabulation shows that 32% of female and 26% of male respondents have said that they strongly agree that each ethnic group has the right to maintain its unique traditions. In other words, female were about one and a quarter times (32.0/26.0=1.23) more likely to have said they strongly agreed that each ethnic group has the right to maintain its unique traditions than survey respondents who were male.
Steps in solving crosstabulation problems - 1 Question: is group defined by independent variable more (less) likely to have dependent variable characteristic? Create cross-tabulated table in SPSS with independent variable as the column variable and the dependent as the row variable. Include column percentages. Is the column percentage in the dependent variable category larger (smaller) for the more (less) likely group? No False NOTE: when the column percentages are very similar, we can say the groups are about equally likely. Yes True
Steps in solving crosstabulation problems - 2 Question: is there a relationship between the independent and the dependent variable? Create cross-tabulated table in SPSS with independent variable as the column variable and the dependent as the row variable. Include column percentages. Differences in the column percentages equal to or larger than 10% in any category of the dependent variable (ignoring rows or columns with fewer than 10 subjects)? No False When a problem includes two variables, but does not identify the role of either one, treat the first mentioned variable as the independent variable. Yes True
Steps in solving crosstabulation problems - 3 Question: is group defined by independent variable ? times more likely to have dependent variable characteristic? Create cross-tabulated table in SPSS with independent variable as the column variable and the dependent as the row variable. Include column percentages. Is the percent in the independent variable category for the more likely group ÷ the percent for the less like group equal to the correct ratio? No False Yes True