Download
1 / 43
430 likes | 588 Vues
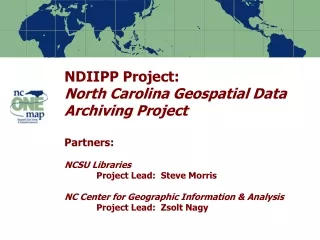
NDIIPP Project: Collection and Preservation of At-Risk Digital Geospatial Data Partners: NCSU Libraries Project Lead: Steve Morris NC Center for Geographic Information & Analysis Project Lead: Zsolt Nagy. Project Context. Partnership between university library (NCSU) and state agency (NCCGIA)

E N D
NDIIPP Project:Collection and Preservation of At-Risk Digital Geospatial DataPartners:NCSU LibrariesProject Lead: Steve MorrisNC Center for Geographic Information & AnalysisProject Lead: Zsolt Nagy
Project Context • Partnership between university library (NCSU) and state agency (NCCGIA) • $520,000 funding • Focus on state and local geospatial content in North Carolina (statedemonstration) • Tied to NC OneMap, which provides seamless access to data, metadata, and inventory information Note: Percentages based on the actual number of respondents to each question
Targeted Content • Resource Types • GIS “vector” (point/line/polygon) data • Digital orthophotography • Digital maps • Tabular data (e.g. assessment data) • Content Producers • Mostly state, local, regional agencies • Some university, not-for-profit, commercial • Selected local federal projects Note: Percentages based on the actual number of respondents to each question
Vector data (scale, accuracy, currency, etc.) Note: Percentages based on the actual number of respondents to each question
Time series – vector data Parcel Boundary Changes 2001-2004, North Raleigh, NC Note: Percentages based on the actual number of respondents to each question
Aerial imagery (image resolution, etc.) Note: Percentages based on the actual number of respondents to each question
Aerial imagery (image resolution, etc.) Note: Percentages based on the actual number of respondents to each question
Aerial imagery (image resolution, etc.) Note: Percentages based on the actual number of respondents to each question
Aerial imagery (image resolution, etc.) Note: Percentages based on the actual number of respondents to each question
Time series – Ortho imagery Vicinity of Raleigh-Durham International Airport 1993-2002 Note: Percentages based on the actual number of respondents to each question
Tabular data (combined with vector data) Note: Percentages based on the actual number of respondents to each question
Tabular data (combined with vector data) Note: Percentages based on the actual number of respondents to each question
Tabular data (combined with vector data) Note: Percentages based on the actual number of respondents to each question
Earlier Acquisition Efforts • NCSU University Extension project 2000-2001 • Target: County/city data in eastern NC • “Digital rescue” not “digital preservation” • Project learning outcomes • Confirmed concerns about long term access • Need for efficient inventory/acquisition • Wide range in rights/licensing • Need to work within statewide infrastructure • Acquired experience; unanticipated collaboration Note: Percentages based on the actual number of respondents to each question
Improving Access to Local Content and Services County and City GIS Directories Note: Percentages based on the actual number of respondents to each question
Processing Ingested Data e.g. Testing for data gaps in county orthophoto sets Note: Percentages based on the actual number of respondents to each question
Geographic Information Services - Trends Map Collections Data Collections Map Servers Map Portals • Map Collections • Paper Maps • Data Collections • CD-ROMs, File server & FTP access • Map Servers • Integrate collected data, Web-based mapping • Now: Map Portals and Streaming Data • Front end to distributed, streaming data (OpenGIS) Note: Percentages based on the actual number of respondents to each question
Content Identification and Selection • Work from NC OneMap Data Inventory • Combine with inventory information from various state agencies and from previous NCSU efforts • Develop methodology for selecting from among “early,” “middle,” and “late” stage products • Develop criteria for time series development • Investigate use of emerging Open Geospatial Consortium technologies in data identification Note: Percentages based on the actual number of respondents to each question
Content Acquisition • Work from NC OneMap Data Sharing Agreements as a starting point (the “blanket”) • Secure individual agreements (the “quilt”) • Investigate use of OGC technologies in capture • Use METS as a metadata wrapper • Ingest FGDC metadata (crosswalk to MODS?) • Maybe METS DRM short term; GeoDRM long term • Consider PREMIS elements (extract from FGDC?) • Consider links to services; version management Note: Percentages based on the actual number of respondents to each question
Partnership Building • Work within context of the NC OneMap initiative • State, local, federal partnership • State expression of the National Map • Defined characteristic: “Historic and temporal data will be maintained and available” • Advisory Committee drawn from the NC Geographic Information Coordinating Council subcommittees • Seek external partners • National States Geographic Information Council • FGDC Historical Data Committee • … more Note: Percentages based on the actual number of respondents to each question
Content Retention and Transfer • Ingest into Dspace • Look more generically at the issue of putting geospatial content into digital repositories • Investigate re-ingest into a second platform • Start to define format migration paths • Special problem: geodatabases • Purse long term solution • Roles of data producing agencies, state agencies; NC OneMap; NCSU Note: Percentages based on the actual number of respondents to each question
End of Project Outcomes • Components which become part of state geospatial data infrastructure • NC OneMap objectives for long term access • Start a dialog about digital preservation; create stories about digital preservation that can be told in geospatial industry venues • Components which NCSU Libraries continues for its own business reasons • High user demand for local data, historical versions • Components which are not sustainable Note: Percentages based on the actual number of respondents to each question
Big Problems/Issues • Management of data versions over time • How to “get current object/metadata/DRM” from a given data object? • Relation of the canonical metadata package to the ingest (and export) metadata package for a particular repository environment • Tailor the canonical package to the repository environment or make the acquaintance when needed? • Format migration paths (geodatabases, etc.) Note: Percentages based on the actual number of respondents to each question
Big Problems/Issues (Continued) • Preserving relational databases • Role of persistent identifiers • Semantic issues (data attributes, etc.) • Viability of web services consumption as an archive development approach • Getting data sharing agreements to cover preservation use cases • Relation of DRM statement & rights for current object to older versions of object Note: Percentages based on the actual number of respondents to each question
Note: Percentages based on the actual number of respondents to each question
Find – View – Get North Carolina’s Digital Geospatial Data A Comprehensive, Statewide Geographic Data Resource Note: Percentages based on the actual number of respondents to each question
NC Local Landscape • 100 Counties, 92 With GIS • 80 Counties with 1st Run Hi Res DB • 60+ Counties with Unique Map Servers. • Growing Number of Municipal Systems • $162 Million Plus . . . Note: Percentages based on the actual number of respondents to each question
NC Geographic Information Coordinating Council (GICC) • General Statute • 32 Member Council • 10 Local Members • Committees – LGC; FIC; SGUC; SMAC; TAC • Administrative Agency – NC CGIA Note: Percentages based on the actual number of respondents to each question
Note: Percentages based on the actual number of respondents to each question
Note: Percentages based on the actual number of respondents to each question
Note: Percentages based on the actual number of respondents to each question
Note: Percentages based on the actual number of respondents to each question
Note: Percentages based on the actual number of respondents to each question
Note: Percentages based on the actual number of respondents to each question
Note: Percentages based on the actual number of respondents to each question
Note: Percentages based on the actual number of respondents to each question
Note: Percentages based on the actual number of respondents to each question
Note: Percentages based on the actual number of respondents to each question
NC OneMap Data Survey • Contains specific questions about hardware, software, databases, projections, data distribution, metadata, and GIS “framework” data layers (frequency of update, scale, attributes, maintenance, source) • For consistency purposes, modeled after the NC Floodplain Mapping GIS Survey • Contains questions that address federal homeland security requirements Note: Percentages based on the actual number of respondents to each question
NC OneMap Initial Data Layers Produced by Cities and Counties Note: Percentages based on the actual number of respondents to each question
Benefits of NC OneMap • Better informed decisions • Seamless map integration when tapping local, state, and federal data sources • Enhanced statewide coordination and cost-savings • Integration of data from multiple communities and jurisdictions presents new opportunities to address regional issues and problems • NC OneMap is in line with The National Map initiative • Statewide community of geographic data stakeholders tackles the technical and policy issues • Successful intergovernmental collaboration rewards elected officials, government leaders and North Carolina citizens Note: Percentages based on the actual number of respondents to each question
Note: Percentages based on the actual number of respondents to each question
Questions? Note: Percentages based on the actual number of respondents to each question