The Herald-Sun, 24 July
850 likes | 1.13k Vues
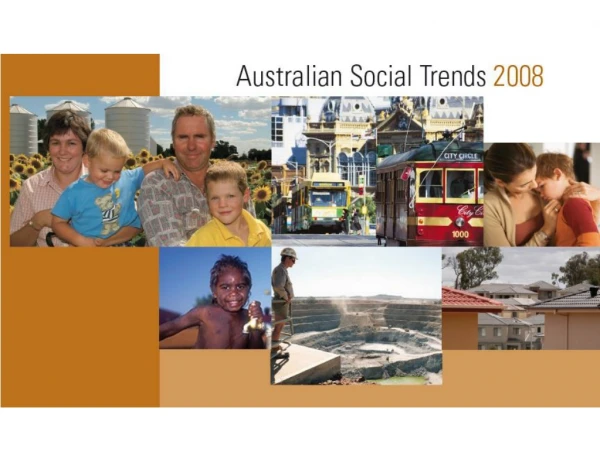
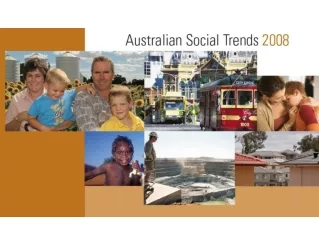
The Australian, 24 July. The Herald-Sun, 24 July. The Age, 24 July. The Herald-Sun, 24 July. The Australian Financial Review, 24 July. The Canberra Times, 24 July. The Australian, 24 July. The Courier Mail, 24 July. Features of Australian Social Trends. 23 articles in 2008

The Herald-Sun, 24 July
E N D
Presentation Transcript
The Australian, 24 July The Herald-Sun, 24 July The Age, 24 July The Herald-Sun, 24 July The Australian Financial Review, 24 July The Canberra Times, 24 July The Australian, 24 July The Courier Mail, 24 July
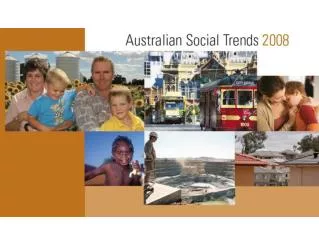
Features of Australian Social Trends 23 articles in 2008 Almost 400 social indicators Cumulative topic index Draws on statistics from other official sources in addition to ABS data
Population Population distribution…by Remoteness Areas…change 1996-2006 How many children havewomen in Australia had?…over the last 20 years…Indigenous women
Australians are amongthe most long-lived in the world Source: OECD Social Indicators, 2006 edition
Remoteness Areas and populationdistribution at 30 June 2006 Source: ABS preliminary Estimated Resident Population
Population change in States and Territories1996–2006(a) (a) Average annual growth rate Source: ABS Estimated Resident Population
Population change 1996–2006(a) (a) Average annual growth rate Source: ABS preliminary Estimated Resident Population
How many children have women in Australia had? Source: 1986, 1996 and 2006 Censuses of Population and Housing
Completed fertility Source: 1986, 1996 and 2006 Censuses of Population and Housing
Children ever bornto Indigenous women 2006 • 14,300 Indigenous women aged 40–44 years in 2006... • Average number of children ever born among these women was 2.8 • Higher than among non-Indigenous women, at 2.0
Children ever born bymother's age 2006 Source: 2006 Census of Population and Housing
Family and Community Families with a young child with a disability…how many?… socioeconomic status and labour force status Voluntary work…increase in voluntary work…who is volunteering regularly?
Families with a childwith a disability 2003 285,000 families 320,000 children Source: ABS 2003 Survey of Disability, Ageing and Carers
Families with a childwith a disability 2003 Labour force participation of parents One-parent families Couple families Couple families One-parent families Source: ABS 2003 Survey of Disability, Ageing and Carers
Families with a childwith a disability 2003Income Source: ABS 2003 Survey of Disability, Ageing and Carers
Families with a childwith a disability 2003Effect of caring role on primary carer Source: ABS 2003 Survey of Disability, Ageing and Carers
Volunteering rates Source: ABS 2006 Voluntary Work Survey
Regular volunteering by age and sex 2006 Source: ABS 2006 Voluntary Work Survey
Regular volunteers by type oforganisation 2006 Source: ABS 2006 Voluntary Work Survey
Health Risk taking by young people…alcohol, drugs & dangerous driving People with a need for assistance…who are they? Complementary therapies …have become more common
Australians' health - major risk factors Overweight/obese (BMI 25+) Little or no exercise Long term risky/high risk drinking Current smokers Source: ABS, National Health Survey
Risk taking by young people Short term risky/high risk drinkingat least once a week 2004–05 Source: ABS 2004–05 National Health Survey
Short term risky/high risk drinkingat least once a week 2004–05 (a) Data are not available for the Northern Territory Source: ABS 2004–05 National Health Survey
Dangerous driving related offences 2006–07 –Exceeding the legal alcohol limit –Driving under the influence –Dangerous or negligent driving –Speeding Source: ABS Criminal Courts Collection
Alcohol and drug-relatedhospitalisations 2005–06 –Males, drug use –Females, drug use –Males, acute alcohol intoxication –Females, acute alcohol intoxication Source: AIHW Hospital Morbidity Database
Transport accident hospitalisationspeople aged 15–24 years2005-06 Source: AIHW Hospital Morbidity Database
Transport accident deaths(15-24 years) Source: ABS Causes of Death collection
Age-specific death rates(a)2002-2006 Males Females Source: Deaths, Australia 2006 (a) Data for Qld, SA, WA and NT combined
Indigenous : non-Indigenousdeath rate ratios(a) 2002-2006 Source: Deaths, Australia 2006 (a) Data for Qld, SA, WA and NT combined
People with a need for assistance…age and sex, 2006 Source: ABS 2006 Census of Population and Housing
Living arrangements for children and young people: with and without a need for assistance Aged 0-14 years Aged 0-14 years Aged 15-24 years Source: ABS 2006 Census of Population and Housing
Living arrangements for people aged over 65 years: with and without a need for assistance Source: ABS 2006 Census of Population and Housing
People with a need for assistance…participation in education • The majority (97%) of children aged 5–17 years with a need for assistance attended an educational institution in 2006 • For young adults aged 18–24 years with a need for assistance, 31% attended an educational institution • These young adults were most likely to attend a technical college (12%) and least likely to be attending university (5%) Source: ABS 2006 Census of Population and Housing
Labour force characteristics,persons aged 15-64 years with and without a need for assistance - 2006 Source: ABS 2006 Census of Population and Housing
Distribution of persons aged less than 65 years by equivalised household income quintile: with and without a need for assistance Source: ABS 2006 Census of Population and Housing
Complementary therapies • Number of complementary therapists is small but growing quickly, from 4,787 in 1996 to 8,595 in 2006. • Fastest growing occupation group is osteopaths • Leading occupation groups are naturopaths and chiropractors Source: 1996 & 2006 Censuses of Population and Housing
Complementary therapists Source: 1996 & 2006 Censuses of Population and Housing
Characteristics of therapists 2006 Source: ABS 2006 Census of Population and Housing
Visits to therapists (last two weeks) Source: ABS 1995 and 2004–05 National Health Surveys
Users of complementary therapists 2004–05 Source: ABS 2004–05 National Health Survey
Education • Non-school qualifications…over time • Adult literacy…prose literacy
Proportion of Australianswith a non-school qualification (ages 25-64) – Total with a non-school qualification – Advanced diploma and diploma or below – Bachelor degree or above Source:ABS 1990-2006 Survey of Education and Work
Adult literacy 2006 % Source: 2006 ALLS
Adults with adequate orbetter prose literacy 2006 % Source: 2006 ALLS
Adult prose literacy by sex, 2006 % Source: 2006 ALLS
Populations with low/highprose literacy 2006 % Source: 2006 ALLS
Adequate prose literacy:international comparison 2006 Source: Adult Literacy and Life Skills Survey, Summary Results
Work Labour force participation across Australia…over time…sex and age Trade union members…sex and age…industry type