Download
1 / 53
650 likes | 1.37k Vues
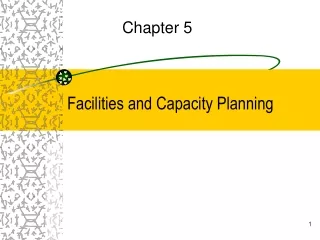
Facilities Planning - Unit 12 Facilities Location Planning and Analysis. Hierarchy of Facility Planning. Facility Location. Structural Design. Facility Planning. Facility Design. Layout Design. Handling System Design.

E N D
Facilities Planning - Unit 12Facilities Location Planning and Analysis
Hierarchy of Facility Planning Facility Location Structural Design Facility Planning Facility Design Layout Design Handling System Design Source for Figure: Tompkins and White, Facilities Planning, 2nd edition, Wiley Facilities Location Planning and Analysis - 2
Need for Location Decisions • Marketing Strategy • Cost of Doing Business • Growth • Depletion of Resources Plant location decisions are made by corporate executrices / plant owners Facilities Location Planning and Analysis - 3
Nature of Location Decisions • Strategic Importance • Long term commitment/costs • Impact on investments, revenues, and operations • Supply chains • Objectives • Profit potential • No single location may be better than others • Identify several locations from which to choose • Options • Expand existing facilities • Add new facilities • Move Facilities Location Planning and Analysis - 4
Making Location Decisions • Decide on the criteria • Identify the important factors • Develop location alternatives • Evaluate the alternatives • Make selection Qualitative and Quantitative methods are used to evaluate and select locations for facilities Facilities Location Planning and Analysis - 5
Location Decision Factors Regional Factors Community Considerations Site-related Factors Facilities Location Planning and Analysis - 6
Location Decision FactorsRegional Factors • Location of raw materials • Location of markets • Labor factors • Climate and taxes Facilities Location Planning and Analysis - 7
Location Decision FactorsCommunity Considerations • Quality of life • Services • Attitudes • Taxes • Environmental regulations • Utilities • Developer support Facilities Location Planning and Analysis - 8
Location Decision FactorsSite Related Factors • Land • Transportation • Environmental • Legal Facilities Location Planning and Analysis - 9
Location Decision Factors Facilities Location Planning and Analysis - 10
Location Factors- Types of Facilities • Mining, Quarrying, Heavy manufacturing • auto plants, steel mills, chemical plants • Light industry • small components manufacturing, assembly • Warehouse & distribution centers • Retailing • Customer service for profit • Local government services • Health and emergency services Facilities Location Planning and Analysis - 11
Location Factors vs. Types of Facilities Facilities Location Planning and Analysis - 12
Level Activity Space Planning Unit Environment Output I Global Site Location & Selection Sites World or Country II Supra Site Planning Buildings or Site Features Site III Macro Layout Building Department or Block Layout Work cells or Departments Building IV Micro Layout Work cell of Department Workstations or Work cell Features Cells or Departments V Sub Micro Layout Workstation Design Tool & Fixture Locations Workstation Layout Levels Facilities Location Planning and Analysis - 13 From: http://www.strategosinc.com/facility_plan_levels.htm
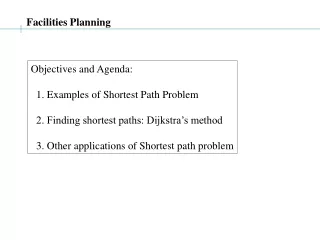
Facilities Location PlanningDecision Support Tools • Factor rating method • Load-distance model • Center of gravity approach • Break-even analysis • Transportation method (covered in details in Operation Research course) Facilities Location Planning and Analysis - 14
Decision Support ToolsLocation Rating Factor – Example 1 • Identify important factors • Weight factors (usually 0.00 - 1.00 or 0.00 - 100) • Subjectively score each factor • Sum weighted scores Facilities Location Planning and Analysis - 15
Scores (0 to 100) Location Factor Weight Site 1 Site 2 Site 3 80 100 60 75 65 85 50 Labor pool and climate Proximity to suppliers Wage rates Community environment Proximity to customers Shipping modes Air service .30 .20 .15 .15 .10 .05 .05 65 91 95 80 90 92 65 90 75 72 80 95 65 90 Decision Support ToolsLocation Rating Factor – Example 2 Facilities Location Planning and Analysis - 16
Weighted Scores Location Factor Site 1 Site 2 Site 3 Labor pool and climate Proximity to suppliers Wage rates Community environment Proximity to customers Shipping modes Air service Total Score 24.00 20.00 9.00 11.25 6.50 4.25 2.50 77.50 19.50 18.20 14.25 12.00 9.00 4.60 3.25 80.80 27.00 15.00 10.80 12.00 9.50 3.25 4.50 *82.05 Decision Support ToolsLocation Rating Factor – Example 2 continued Facilities Location Planning and Analysis - 17
Decision Support ToolsLocation Rating Factor – Example 3 A payroll processing company has recently won several major contracts in the Midwest region of the United States and Central Canada and wants to open a new, large facility to serve these areas. Because customer service is so important, the company wants to be as near its “customers” as possible. A preliminary investigation has shown that Minneapolis, Winnipeg, and Springfield, Illinois are the three most desirable locations, and the payroll company has to select one of these. A subsequent thorough investigation of each location with respect to eight important factors generated the raw scores and weights. Using the location scoring method, determine the best location for the new payroll processing facility. Facilities Location Planning and Analysis - 18
Decision Support ToolsLocation Rating Factor – Example 3 Factors and weights for three locations Score Weight 0.25 0.15 0.15 0.10 0.10 0.10 0.08 0.07 Factor Proximity to customer Land and construction prices Wage rates Property taxes Business taxes Commercial travel Insurance costs Office services Minneapolis 95 60 70 70 80 80 70 90 Winnipeg 90 60 45 90 90 65 95 90 Springfield 65 90 60 70 85 75 60 80 Facilities Location Planning and Analysis - 19
Weighted scores for three locations Weighted Score Factor Proximity to customer Land and construction prices Wage rates Property taxes Business taxes Commercial travel Insurance costs Office services Sum of weighted scores Minneapolis 23.75 9.00 10.50 7.00 8.00 8.00 5.60 6.30 78.15 Winnipeg 22.50 9.00 6.75 9.00 9.00 6.50 7.60 6.30 76.65 Springfield 16.25 13.50 9.00 7.00 8.50 7.50 4.80 5.60 72.15 Decision Support ToolsLocation Rating Factor – Example 3 continued Facilities Location Planning and Analysis - 20
Decision Support ToolsLocation Rating Factor – Example 4 Facilities Location Planning and Analysis - 21
Decision Support ToolsLoad Distance Model • Compute the distance from each site to each supplier (Distance can be actual or straight-line) • Compute load-distances • Choose site with lowest load-distance Facilities Location Planning and Analysis - 22
n li di LD = i = 1 where, LD = the load-distance value li = the load expressed as a weight, number of trips or units being shipped from the proposed site and location i di = the distance between the proposed site and location i di = (xi - x)2 + (yi - y)2 where, (x,y) = coordinates of proposed site (xi , yi) = coordinates of existing facility Decision Support ToolsLoad Distance Model Facilities Location Planning and Analysis - 23
= 161.2 Site 1 dA = (xA - x1)2 + (yA - y1)2 = (200-360)2 + (200-180)2 = 412.3 dB = (xB - x1)2 + (yB - y1)2 = (100-360)2 + (500-180)2 dC = 434.2 dD = 184.4 Decision Support ToolsLoad Distance Model - Example Potential Sites Site X Y 1 360 180 2 420 450 3 250 400 Suppliers A B C D X 200 100 250 500 Y 200 500 600 300 Wt 75 105 135 60 Compute distance from each site to each supplier Facilities Location Planning and Analysis - 24
Site 2 dA = 333 dB = 323.9 dC = 226.7 dD = 170 Site 3 dA = 206.2 dB = 180.4 dC = 200 dD = 269.3 Decision Support ToolsLoad Distance Model - Example continued Compute load-distance n LD = li di i = 1 Site 1 = (75)(161.2) + (105)(412.3) + (135)(434.2) + (60)(434.4) = 125,063 Site 2 = (75)(333) + (105)(323.9) + (135)(226.7) + (60)(170) = 99,789 Site 3 = (75)(206.2) + (105)(180.3) + (135)(200) + (60)(269.3) = 77,555 * Facilities Location Planning and Analysis - 25
Decision Support ToolsCenter-of-Gravity Technique • Locate facility at center of geographic area • Based on weight & distance traveled • Establish grid-map of area • Identify coordinates & weights shipped for each location Facilities Location Planning and Analysis - 26
n n xiWi yiWi i = 1 i = 1 x = y = n n Wi Wi i = 1 i = 1 Decision Support ToolsCenter-of-Gravity Technique: Grid-Map and Coordinates y 2 (x2, y2), W2 y2 1 (x1, y1), W1 y1 where, x, y = coordinates of the new facility at center of gravity xi, yi= coordinates of existing facility i Wi = annual weight shipped from facility i 3 (x3, y3), W3 y3 x1 x2 x3 x Facilities Location Planning and Analysis - 27
y 700 C 600 B o 500 Center 400 D 300 A 200 100 0 x 100 200 300 400 500 600 700 Decision Support ToolsCenter-of-Gravity Technique - Example A B C D X 200 100 250 500 Y 200 500 600 300 Wt 75 105 135 60 Facilities Location Planning and Analysis - 28
n xiWi i = 1 (200)(75) + (100)(105) + (250)(135) + (500)(60) x = n 75 + 105 + 135 + 60 Wi i = 1 n yiWi i = 1 (200)(75) + (500)(105) + (600)(135) + (300)(60) y = n 75 + 105 + 135 + 60 Wi i = 1 Decision Support ToolsCenter-of-Gravity Technique – Example continued = 238 = = = 444 Facilities Location Planning and Analysis - 29
Decision Support ToolsBreak-Even Analysis Total cost = fixed costs + variable costs (quantity): Revenue = selling price (quantity) Break-even point is where total costs = revenue: Facilities Location Planning and Analysis - 30
Decision Support ToolsBreak-Even Analysis – Example 1 A firm estimates that the fixed cost of producing a line of footwear is $52,000 with a $9 variable cost for each pair produced. They want to know: • If each pair sells for $25, how many pairs must they sell to break-even? • If they sell 4000 pairs at $25 each, how much money will they make? Facilities Location Planning and Analysis - 31
Decision Support ToolsBreak-Even Analysis – Example 1 continued • Break-even point: • Profit = total revenue – total costs Facilities Location Planning and Analysis - 32
Decision Support ToolsBreak-Even Analysis – Outsourcing Facilities Location Planning and Analysis - 33
Decision Support ToolsBreak-Even Analysis – Outsourcing Example Bill & Nancy plan to open a small bagel shop. • The local baker has offered to sell them bagels at 40 cents each. However, they will need to invest $1,000 in bread racks to transport the bagels back & forth from the bakery to their store. • Alternatively, they can bake the bagels at their store for 15 cents each if they invest $15,00 in kitchen equipment. • They expect to sell 60,000 bagels each year. What should they do? Facilities Location Planning and Analysis - 34
Decision Support ToolsBreak-Even Analysis – Outsourcing Example continued Interpretation: • They anticipate selling 60,000 bagels (greater than the indifference point of 56,000). • Therefore, make the bagels in-house. Facilities Location Planning and Analysis - 35
Location Fixed Cost Variable Cost $250,000 A $11 100,000 B 30 150,000 C 20 35 200,000 D Decision Support ToolsBreak-Even Analysis: Cost-Volume Analysis Example Fixed and variable costs for four potential locations Facilities Location Planning and Analysis - 36
Decision Support ToolsBreak-Even Analysis: Cost-Volume Analysis Example Facilities Location Planning and Analysis - 37
Decision Support ToolsBreak-Even Analysis: Cost-Volume Analysis Example $(000) 800 700 600 500 400 300 200 100 0 D B C A A Superior C Superior B Superior 0 2 4 6 8 10 12 14 16 Annual Output (000) Facilities Location Planning and Analysis - 38
Supplement – Supply Chain Management and Global Location Factors Facilities Location Planning and Analysis - 39
Supply Chain Management • Facilities, functions, activities for producing & delivering product or service from supplier to customer • Planning, managing, acquiring, producing, warehousing, distribution, delivery Facilities Location Planning and Analysis - 40
Supply Chain ManagementFacilities • Plants • Warehouses • Distribution centers • Service centers • Retail operations Facilities Location Planning and Analysis - 41
Supply Chain ManagementTransportation and Distribution • Rail • Truck • Air • Water • Pipeline • Computer • Mail • Telephone • In person Facilities Location Planning and Analysis - 42
Supply Chain ManagementTransportation and Distribution - Railroads • 150,000 miles in US • Low cost, high-volume • Improving flexibility • intermodal service • double stacking Facilities Location Planning and Analysis - 43
Supply Chain ManagementTransportation and Distribution - Trucks • Most used mode in US • Flexible, small loads • Part of TQM supplier-customer relationship • Single sourcing reduces number of trucking firms serving a company Facilities Location Planning and Analysis - 44
Supply Chain ManagementTransportation and Distribution - Airfreight • Rapidly growing segment of transportation industry • Lightweight, small items • Quick, reliable, expensive • Often combined with trucking operations • UPS, FEDEX Facilities Location Planning and Analysis - 45
Supply Chain ManagementTransportation and Distribution - Waterways • One of oldest means of transport • Low-cost, high-volume, slow • Bulky, heavy and/or large items • Standardized shipping containers improve service • Combined with trucking & rail for complete systems Facilities Location Planning and Analysis - 46
Supply Chain ManagementTransportation and Distribution - Pipelines • Primarily for oil & refined oil products • Slurry lines carry coal or kaolin • High capital investment • Low operating costs • Can cross difficult terrain Facilities Location Planning and Analysis - 47
Supply Chain ManagementUncertainties Major goal of distribution is speed. Factors that can create obstacles to this goal: • Wrong forecasts • Late deliveries • Poor quality • Machine breakdowns • Canceled orders • Erroneous information Facilities Location Planning and Analysis - 48
Supply Chain ManagementGlobal Location Factors Facilities Location Planning and Analysis - 49
Supply Chain ManagementGlobal Location Factors - continued Facilities Location Planning and Analysis - 50