Facilities and Aggregate Planning
70 likes | 264 Vues
Facilities and Aggregate Planning. Overview. As you know there are 24 hours a day, 7 days a week. What can you get done in a week period? Firms need to come to grips with what can be accomplished in any time frame.

Facilities and Aggregate Planning
E N D
Presentation Transcript
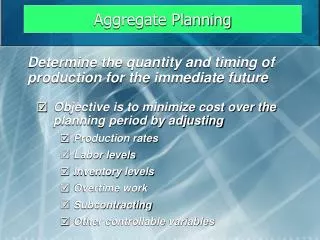
Overview As you know there are 24 hours a day, 7 days a week. What can you get done in a week period? Firms need to come to grips with what can be accomplished in any time frame. Capacity is the maximum output that can be produced over a given time period. Nominal, or effective, capacity builds in the downtime for machine repairs, shift breaks and the like that make nominal capacity lower. Facilities and decisions regarding facilities have a major impact on what the firm can accomplish.
Facilities Strategy Of course the author suggests that the firm have an overall strategy about facilities as opposed to “incremental capital budgeting” decisions. This means the firm must look beyond just whether a facility will have more revenue than cost. Factors to consider when formulating strategy are 1) Level of predicted demand, 2) Cost of facilities, 3) Response of competitors to firm decisions, 4) The fit with overall business strategy, and 5) International considerations.
Capacity Cushion Capacity cushion is defined as capacity minus average demand. This is a measure of the firms ability to meet the average demand in the market. Let’s study the solved problem on pages 268 and 269 to put some associated ideas into context. Say demand from period to period is uncertain but has the following probability distribution for a chemical company: 1000’s of gallons demanded 100 110 120 130 140 Probability .1 .2 .3 .3 .1 The average, or expected, demand is the sum of the product of each demand amount and its associated probability: 100(.1) + 110(.2) + 120(.3) + 130(.3) + 140(.1) = 10 + 22 + 36 + 39 + 14 = 121
Capacity Cushion If capacity is set at 130 there will be a cushion = 9. Anytime demand is less than 130 there will be idle capacity and this will occur .1 + .2 + .3 = .6 or 60% of the time. Average utilization of the plant is what % of the 130 is being used and it equals the sum of the product of each utilization rate times its probability of occurrence. When demand is 100 the utilization is 100/130, so in total we have (100/130).1 + (110/130).2 + (120/130).3 + (130/130).3 + (130/130).1 = 10/130 + 22/130 + 36/130 + 39/130 + 13/130 = (10 + 22 + 36 + 39 + 13)/ 130 = .9231 or 92.31% Note when demand is 140 the plant can only make 130 for full utilization.
Capacity Cushion Say that the business will lose $100,000 in revenue for each 1000 gallons it can not deliver, and it costs $5000 to build each 1000 gallons of capacity. There is a trade-off then between capacity and not being able to meet demand. I reproduce the probability distribution for a chemical company: 1000’s of gallons demanded 100 110 120 130 140 Probability .1 .2 .3 .3 .1 So if 100 capacity is built, unmet demand is 0(.1) 10(.2) 20(.3) 30(.3) 40(.1) = 21 Similarly for 110 capacity 0(.1) 0(.2) 10(.3) 20(.3) 30(.1) = 12 Similarly for 120 capacity 0(.1) 0(.2) 0(.3) 10(.3) 20(.1) = 5 Similarly for 130 capacity 0(.1) 0(.2) 0(.3) 0(.3) 10(.1) = 1 Similarly for 140 capacity 0(.1) 0(.2) 0(.3) 0(.3) 0(.1) = 0
Capacity Cushion On the previous slide we see if 100 capacity is built the firm will not be able to meet 21 units of demand (in a probabilistic sense). The total cost is thus 500,000 + 2,100,000 = 2,600,000 When it adds 10 more in capacity, an additional 50,000 in cost in building is put on but it reduces lost sale cost on 9 units. SO the extra 50,000 in building cost saves 900,000 in lost sales. This change is a bargain. It makes sense to build 140 capacity because even that extra 10 over 130 adds 50,000 in cost but saves 100,000 on the reduction in lost sales. In this case the building cost is low enough relative to lost revenue to build lots of capacity.