Download
1 / 35
350 likes | 502 Vues
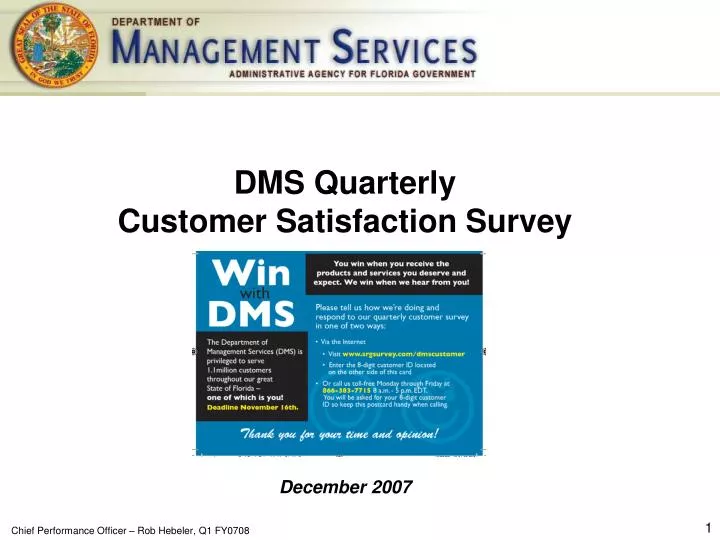
DMS Quarterly Customer Satisfaction Survey. December 2007. A Few Words First …. The journey of continual improvement is not one for uninspired leadership or poor management. It is difficult. It is hard to always focus on how to get better on this day, and every day moving forward.

E N D
DMS Quarterly Customer Satisfaction Survey December 2007
A Few Words First … • The journey of continual improvement is not one for uninspired leadership or poor management. It is difficult. It is hard to always focus on how to get better on this day, and every day moving forward. • Our customers expect and deserve service and product excellence. We should do nothing less to strive and meet this level of expectation. • The key to success rests in our ability and desire to build relationships with each other and with our customers.
Agenda • Background • Executive Overview • Survey Design • Survey Implementation • Survey Findings • Closing Remarks and Suggestions for the Future
Background Survey Design Survey Implementation Survey Findings Closing Remarks Background • In January 2007, Secretary South and team embarked on a journey of continual improvement. This journey was marked with the development of an innovative Customer Quality Assurance Framework that involved the entire organization. • In June 2007, the department launched a customer satisfaction survey to benchmark product and service attributes, overall satisfaction and problem resolution. The survey was distributed to a random sample of the departments’ 1.1 million customers. The resulting benchmarks established our starting line and launched our journey of “measuring what matters.” We established our continual improvement goal of a 2% increase of “Extremely Satisfied” for each quarter moving forward. • In October 2007, the department launched its first customer satisfaction survey for the fiscal year. The Q1 FY0708 survey used an online format with a phone-based helpline. • The results of the customer satisfaction surveys enables the department to • Gauge customer satisfaction over time. • Gauge customer product and service performance over time. • Identify key areas where DMS employees excel and where there is opportunity for improvement.
Background Survey Design Survey Implementation Survey Findings Closing Remarks Our Customers Who Have Needs and Expectations of Us 1 Our Playbook How We Get from Here to There 2 Our People Serving with C.L.A.S.S. 3 7 Our Products and Services What We Provide our Customers with and How We Treat Them Continual Improvement What Must Change 4 Process How We Do Things Culture How We Behave Communications How We Keep Everyone Informed 5 Our Results How our Customers Keep Score Our Improvements Opportunities What Needs to be Better 6
Implement best practices to create a workplace of choice that fosters recruitment, development, recognition and reward Improve our contract management capabilities Create robust strategic plans for each major program and service area Focus on the processes and procedures of our core competencies to create a springboard for world-class performance Increase the brand awareness of our programs and services to our customers Develop Human Resource practices that encourage a resilient workforce with the ability and desire to serve in an emergency or natural disaster Measure what matters and continually improve the quality of services delivered to our customers Background Survey Design Survey Implementation Survey Findings Closing Remarks
Survey Question Areas Division Interaction Selection Service Product Overall Satisfaction of Experience vs. Expectation Why do you feel this way? How can we improve? Problem Resolution What types of problems? Background Survey Design Survey Implementation Survey Findings Closing Remarks Q1 FY0708 Online Survey
Zone of Zone of Zone of Zone of Zone of Zone of Zone of Pain Pain Mere Satisfaction Mere Satisfaction Delight Delight Delight A C B Loyalty D Worse Worse Expected Expected Better Better Better F Than Than Than Than Than Expected Expected Expected Expected Expected Dissatisfied Merely Satisfied Delighted Level of Customer Satisfaction The Moment of Truth Loyalty Loyalty Dissatisfied Dissatisfied Merely Satisfied Merely Satisfied Delighted Delighted Level of Customer Satisfaction Level of Customer Satisfaction Source: Moments of Truth by Jan Carlzon
Background Survey Design Survey Implementation Survey Findings Closing Remarks Survey Design • Used a 5-Point Scale to determine the level of satisfaction, and overall experience vs. expectation 5 4 3 2 1 Advocate Loyal Indifferent/ Disappointed Mad Resentful
Background Survey Design Survey Implementation Survey Findings Closing Remarks Customer Experience = Service +Product • Service Attributes build relationships and trust between the service provider and the customer. It’s how we treat our customers. • Friendly • Listened Well • Helpful • Speed of Service • Checked for my Satisfaction
Background Survey Design Survey Implementation Survey Findings Closing Remarks Customer Experience = Service + Product • Product Attributes are those things, tangible or intangible, that the customer values (whether they are paying for it or not). It’s what we give our customers. • Available or Delivered as Promised • Level of Quality • Easy to Understand or Use • Allowed me to Accomplish What I Wanted to Do • Priced Fairly
Background Survey Design Survey Implementation Survey Findings Closing Remarks Survey Implementation • For the Q1 FY0708 Survey, we targeted the 1.1 million DMS customers. We mailed a postcard to a random sample of 40,000 to ensure a statistically sound response. Of this group, 30,000 were given an incentive to participate (the possibility to win a $10 Florida State Scratch-off Lottery Ticket). • Participants had the option of completing the survey online, or call a toll-free helpline
Background Survey Design Survey Implementation Survey Findings Closing Remarks Survey Implementation: Response Rate • 1,124 surveys were collected for a response rate of 3%. We achieved a 95% Confidence Level with a 3.8% Margin of Error. • The Response Rate for the incentive group (Florida Lottery) was about twice that of the non-incentive group (1.7 times) • Nearly one-third of those reporting that they have had contact within the past 3 months were from the - • 32% Retirement Division. • 24% Human Resources People • 17% State Group Insurance
Background Survey Design Survey Implementation Survey Findings Closing Remarks The Q1 FY0708 Survey Says …
Background Survey Design Survey Implementation Survey Findings Closing Remarks DMS Overall Customer Satisfaction Q1 FY0708 • Nearly half of the DMS customersindicated that they were ‘extremely satisfied’ with the experience they have had with their DMS division. TOP 2 BOX: 82% 3 %s are based on those who selected a division to rate. Those who said they had not had contact or left blank were filtered out of these results. However, when filtered back in – the ‘%’ only changes minimally, by less than 1%.
Background Survey Design Survey Implementation Survey Findings Closing Remarks DMS Overall Customer Satisfaction by Division Q1 FY0708 • State Purchasing State Term Contracts Division had the highest percentage of top box scores (extremely satisfied ratings) followed by Retirement Benefits. (Divisions with less then 10 responses were not calculated.) %s are based on those who selected a division to rate. Those who said they had not had contact or left blank were filtered out of these results. However, when filtered back in – the ‘%’ only changes minimally, by less than 1%.
Background Survey Design Survey Implementation Survey Findings Closing Remarks DMS Overall Customer Satisfaction Q1 FY0708 Vs. June 2007 Benchmark • Top Box, “Extremely Satisfied”, increased from 37% to 46% -- a 9% point increase over the June 2007 Benchmark Survey. The quarterly continual improvement goal of a 2% shift of Top Box (38.9%) was surpassed with a 14.2% shift of Top Box Q1 FY0708 TOP BOX: 46% June 2007 Benchmark Survey TOP BOX: 37% %s are based on those who selected a division to rate. Those who said they had not had contact or left blank were filtered out of these results. However, when filtered back in – the ‘%’ only changes minimally, by less than 1%.
Background Survey Design Survey Implementation Survey Findings Closing Remarks DMS Customer Service Attributes Q1 FY0708 • DMS maintained relatively high top box ratings on all of their service attributes—particularly, friendliness, ability to listen well and helpfulness. Percentage of Top Box Scores and Bottom 3 Box Scores by Service Attribute
Background Survey Design Survey Implementation Survey Findings Closing Remarks DMS Customer Service Attributes Q1 FY0708 Vs. June 2007 Benchmark • Since the June 2007 Benchmark Survey, top box scores have risen in all service attributes. The largest increases were found in “Service Checked”, and “Friendly.” Percentage of Top Box Scores by Service Attribute and Quarter * * * *Denotes Statistically Significant Difference p < .05.
Background Survey Design Survey Implementation Survey Findings Closing Remarks Correlation Analysis of Customer Service Attributes to Overall Satisfaction • In general – we see strong correlations between all of the attributes and overall satisfaction. Strong positive relations = higher overall satisfaction ratings. • The level of helpfulness and speed of service is most highly correlated to the level of overall satisfaction, whereas Friendliness is the least correlated. • *Pearson Correlation indicates the strength and direction of a linear relation between two factors. The value ranges between +1 (a perfect positive relation) and -1 (a perfect negative relation). Values greater than .7 indicate an extremely close relation between the factors—that is, as one factor rises, the other factor rises in a very similar fashion.
Background Survey Design Survey Implementation Survey Findings Closing Remarks Quad Analysis of Customer Service Attributes • A Quad Analysis of “customer service attributes,” we see that speed of service will be the primary area where the DMS can focus to impact better ‘overall satisfaction ratings. • In addition, better follow up / wrap up will also be an area to increase performance which in turn will help increase overall satisfaction.
Background Survey Design Survey Implementation Survey Findings Closing Remarks DMS Customer Product Attributes • Compared to bottom three box scores, DMS maintained very high top box ratings for nearly all of their product attributes—particularly, Availability and Quality. The one exception was for Price Value, here the percentage of top box scores was nearly equal to bottom three box scores. Percentage of Top Box Scores and Bottom 3 Box Scores by Product Attribute
Background Survey Design Survey Implementation Survey Findings Closing Remarks DMS Customer Product Attributes Q1 FY0708 Vs. June 2007 Benchmark • Since the June 2007 Benchmark, top box scores for product attributers increased across the board. The largest increases were found in “Quality,” “Allowed to Accomplish” and “Easy to Understand.” The smallest increase was for “Price Value.” Percentage of Top Box Scores by Product Attribute and Quarter * * * * *Denotes Statistically Significant Difference p < .05.
Background Survey Design Survey Implementation Survey Findings Closing Remarks Correlation Analysis of Customer Product Attributes to Overall Satisfaction • Again, we see very strong correlations between all of the attributes and overall satisfaction. Strong positive relations = higher overall satisfaction ratings. • With the exception of Price Value, all products attributes correlated with overall satisfaction at or above .79. • *Pearson Correlation indicates the strength and direction of a linear relation between two factors. The value ranges between +1 (a perfect positive relation) and -1 (a perfect negative relation). Values greater than .7 indicate an extremely close relation between the factors—that is, as one factor rises, the other factor rises in a very similar fashion.
Background Survey Design Survey Implementation Survey Findings Closing Remarks Quad Analysis of Product Attributes • A Quad Analysis of product attributes we see Price is a secondary Opportunity and there is no clearly defined primary opportunity. • Since Price has the least impact on overall satisfaction and there is little to no difference between the other attributes, the best advice to give would be to focus on attributes that are the easiest to and least costly to change. Strengths Maintain Secondary Opportunities Primary Opportunities
Background Survey Design Survey Implementation Survey Findings Closing Remarks Incidence of Problems with DMS Services • Of the customer that had contact with DMS within the past 3 months, only 12% reported that they had experienced a problem. Of those, roughly nearly half (45%) reported it to the DMS. Importantly, when asked about the satisfaction of the resolution they received, nearly half (45%) stated they were very or extremely dissatisfied. Ratings for Resolution after Experiencing a Problem and Reporting it to DMS
Background Survey Design Survey Implementation Survey Findings Closing Remarks Customer Suggestions for Improvement of DMS • The majority of customers (58%) suggested organizational changes to improve DMS (improvement of interdepartmental communications, etc.). Lagging far behind, but still ranked second, was Services (how customers are treated). Relative Percentage of Improvement Comments by Type Categories for Improvement Organizational: Relations between departments, people, merging departments, leadership etc. Products: Tangible/Non-Tangible reference to something they receive or expect to receive. Services: How customers are treated. Process: Efficiencies in day-today operations. Technology: increase efficiencies and means of getting product or service.
Background Survey Design Survey Implementation Survey Findings Closing Remarks Problems that Customers have Experienced* • Password problems; information gathering problems; unable to find desired topics. • Not able to get all info from one place (person) had to call another number to get info. • Website is terrible. • 2 months to make Drs appointment need to speed things up. • People First is not user friendly requiring frequent calls to obtain help. • getting hold of someone to talk to -- could be 3 days before a return call. • Open enrollment through People First was much more difficult than it should have been. Web-based training videos did not function until late in the process. * Note: Unedited Customer Comments
Background Survey Design Survey Implementation Survey Findings Closing Remarks Comments that Represent Suggestions for Improvement from Customers*: • Staff should be better informed; if they can’t answer a question they should know the correct office to forward the person to. • Keep web pages updated. • Call center needs more employees.. • Easier searches on data portal • Have varied office hours so that you can conduct business after 5 p.m. and on Saturdays. • Provide printed materials stating necessary information. • Too many different agencies doing same things. Retirement and investment had to go back and forth too much. • More inter agency communications. It is sometimes hard to know what each agency/division is thinking/doing. We all have personnel with strengths/weaknesses. If we communicate better we can leverage/overcome this. * Note: Unedited Customer Comments
Background Survey Design Survey Implementation Survey Findings Closing Remarks What’s Next …
Background Survey Design Survey Implementation Survey Findings Closing Remarks Rob Hebeler, Chief Performance Officer State of Florida Department of Management Services (850) 487-9887 office, (850) 491-2095 cell phone Rob.Hebeler@dms.myflorida.com We Serve Those Who Serve Florida DMS E-Mail Based Pulse Survey Click on the Survey Link brings you to our Web-based Customer Survey
Background Survey Design Survey Implementation Survey Findings Closing Remarks
Customer Quarterly Survey Schedule • Q2 FY0708 • Launch: Mid-January; Results; Mid-February • Q3 FY0708 • Launch: Mid-April; Results; Mid-May • Q4 FY0708 • Launch: July; Results; August
Overall, DMS is doing a good job on product and service aspects. Indeed, based on the improvement in scores from the benchmark to Q1 FY0708, DMS is getting better! Overall Customer Satisfaction is up 9% points over the June 2007 benchmark. Increasing gains were evidenced in nearly every service and product attribute from the June 2007 Benchmark Survey to the Q1 FY0708 Survey. Customer service attributes of helpfulness and speed of service were found to be the most strongly correlated to overall satisfaction. Simply put, customers want to be helped and helped quickly. When it comes to products, quality and allowing customer to be able to do what they set out to accomplish were the most highly correlated with overall satisfaction. With the exception of product price, all product attributes correlated with overall satisfaction at a value greater or equal to .79. Only 12% of respondents reported having had a problem with DMS. However, when customer problems did arise, problem resolution appeared to be an issue. Nearly half of those who experienced a problem and reported it, said that they were dissatisfied or extremely dissatisfied with the resolution. Quad analysis identified speed of service as a service attribute that is an primary area for changes to be made. With regard to product attributes, no single attribute emerged as a primary candidate for change; therefore, DMS might focus on those attributes that are the easiest to change. Using the information gathered from the open-ended comments about how DMS might improve, 58% of those who responded mentioned organizational changes or improvements—interdepartmental communication, knowledge, etc.). Background Survey Design Survey Implementation Survey Findings Closing Remarks Closing Remarks
DMS Quarterly Customer Satisfaction Survey December 2007