Sifting for Pulsars w ith Jodrell Banks
10 likes | 158 Vues
Sifting for Pulsars w ith Jodrell Banks. b y Paula Bright, Connie Gartner, Rachel Jennings, Mike Mattox, Jane Shamitko and Jen VanDerMolen. Team Jodrell : tasks

Sifting for Pulsars w ith Jodrell Banks
E N D
Presentation Transcript
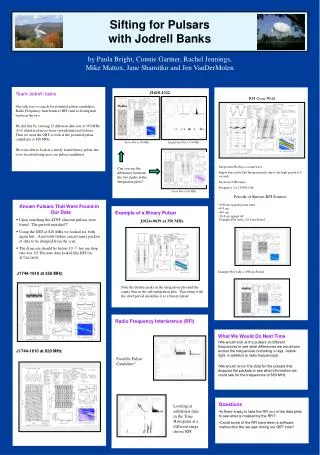
Sifting for Pulsars with Jodrell Banks by Paula Bright, Connie Gartner, Rachel Jennings, Mike Mattox, Jane Shamitko and Jen VanDerMolen Team Jodrell: tasks Our task was to search for potential pulsar candidates, Radio Frequency Interference (RFI) and to distinguish between the two. We did this by viewing 15 different data sets at 350 MHz (6 of which had never been viewed/analyzed before). Then we used the GBT to look at the potential pulsar candidates at 820 MHz. We were able to look at a newly found binary pulsar due to its location being near our pulsar candidates. J1610-1322 RFI Gone Wild Presto Plot at 350 MHz Single Pulse Plot at 350 MHz Integration Plot has a cosine wave Empty bins in the Sub Integration plot due to the high period of 8 seconds Excessive DM range Frequency = 0.124076 (Hz) Can you see the difference between the two peaks in the Integration plots? Presto Plot at 820 MHz • Periods of Known RFI Sources • 1198 ms signals power lines • 933 ms • 467 ms • 16.8 ms signals AC • Known Pulsars That Were Found in Our Data • Upon searching the ATNF a known pulsars were found. The periods matched!!! • Using the GBT at 820 MHz we looked for both again but....A network failure caused many packets of data to be dropped from the scan. • The drop rate should be below 10 -22 but our drop rate was .01 The new data looked like RFI for J1744-1610. Example of a Binary Pulsar Example Plot with a 16.8 ms Period J1024+0039 at 350 MHz Example Plot with a 1198 ms Period J1744-1610 at 350 MHz Note the double peaks in the integration plot and the empty bins in the sub-integration plot. That along with the short period identifies it as a binary pulsar. Radio Frequency Interference (RFI) • What We Would Do Next Time • We would look at the pulsars at different frequencies to see what differences we would see across the frequencies (including x-rays, visible light, in addition to radio frequencies). • We would re-run the data for the pulsars that dropped the packets to see what information we could see for the frequencies of 820 MHz. J1744-1610 at 820 MHz Possible Pulsar Candidate? • Questions • Is there a way to take the RFI out of the data plots to see what is masked by the RFI? • Could some of the RFI have been a software malfunction like we saw during our GBT time? Looking at additional data in the Time Histogram at a different range shows RFI