Understanding Fish Population Dynamics Through Resource Management
This text explores the dynamics of fish population management through recursion and modeling. It provides examples of how to assess populations, utilizing factors like percentage removal and restocking. Key scenarios include the effect of annual fish removal rates and restocking measures, illustrated with various potential long-term outcomes. It also compares fish population control to other resource management scenarios, such as logging and estate management, emphasizing the importance of strategic planning in sustainability.


Understanding Fish Population Dynamics Through Resource Management
E N D
Presentation Transcript
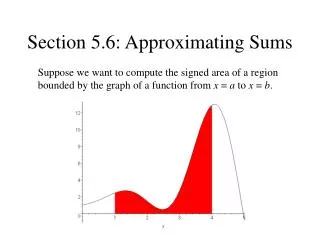
Section 5.6 Resource Management Examples
0 of 30 I see how the fish animation is an example of recursion • Absolutely • Sort of • Not a clue Explain:
Fish Population - + = 1500 700 at end of last year 40% of fish last year Fish this year ? Fish last year
1 of 30 0 / 30 Which graph best describes the fish population “in the long run”? # Fish Years # Fish Years # Fish Years # Fish Years # Fish Years
1 of 30 ? - + … = 700 1500 40% fish last year of fish last year end of last year fish 2 years later • 1220 • 1600 • 1660 • 1696 • 1700
1 of 30 ? - + … = 1500 40% 700 fish last year of fish last year end of last year fish 20 years later • 0 • 1748 • 1749 • 1750 • 3500
1 of 30 - + … ? 3000 = 1000 50% fish last year of fish last year at end of last year fish in 20 years • 750 • 1400 • 1750 • 2000 • 2500
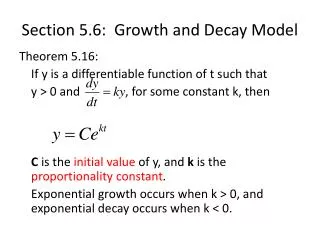
Rule 1 Populations of this sort. We call this number the . of the population
1 of 30 - + ? 500 … = 1000 50% fish last year of fish last year end of last year in the long run • 0 • 1,000 • 1,999 • 2,000 • 15,500
Rule 2 Graphs If you change only the ,the population always . .
This is irrelevant - + = Population now % taken out Number added Population next year
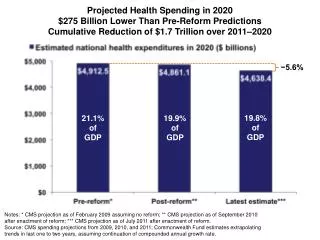
Comparison of Models • Compound interest and retirement funds: exponential . • Paying credit cards: exponential . • Resource management: .
1 of 30 S = Stabilized populationP = Percentage removed in a yearR = Number Restocked at end of a year Which formula describes the relationship between S, P, and R? • a. • b. • c. • None of the above a. P*S = R b. P*R = S c. R*S = P
1 of 30 DEP Announces Deer Reduction at Bluff Point in Groton Deer Reduction • 3% • 27% • 33% • 48% ? - = + … 150 120 40 deer last year %of deer removed at end of year in the long run
1 of 30 Logging (1) - + … ? Trees last year = 12% of trees 10,000 • 120 trees • 800 trees • 1000 trees • 1200 trees • 1400 trees add in the long run
1 of 30 Logging (2) After 3 years a fire destroys half the forest. You continue to cut 12% of the trees annually. You add trees each year • 500 • 750 • 1,000 • 1,250 • 10,000 What will be the stabilizing value of the forest?
1 of 30 Henry is the sole inheritor of his father’s estate. He doesn’t know its current value, but he does know that his father withdraws 20% of it annually. Then at the end of the year he adds $300,000 to the estate. • $60,000 • $150,000 • $240,000 • $1,500,000 • $3,000,000 How much can Henry expect to receive “in the long run”?
“Fish Population” Fish now Fish at start of last year = 40% of fish during last year - 700 at end of last year + Game Warden
Take out 50% Add 1000 Initial population 3000 2000 1500 500 Years