Beach modelling I: Beach erosion occurrence and causes
520 likes | 739 Vues
Beach modelling I: Beach erosion occurrence and causes. Adonis F. Velegrakis Dept Marine Sciences University of the Aegean. Synopsis. 1 Significance of beaches to other ecosystems and economic activity 2 Coastal erosion 3 Causes of beach erosion 4 Climate change: a short review

Beach modelling I: Beach erosion occurrence and causes
E N D
Presentation Transcript
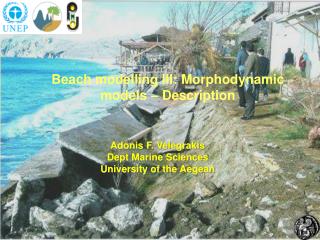
Beach modelling I: Beach erosion occurrence and causes Adonis F. Velegrakis Dept Marine Sciences University of the Aegean
Synopsis 1 Significance of beaches to other ecosystems and economic activity 2 Coastal erosion 3 Causes of beach erosion 4 Climate change: a short review 4.1 Trends 4.2 The mechanism 4.3 The future 4.4 What scenario 5. Erosion costs and adaptation
1 Significance of beaches to other ecosystems and economic activity Beaches, i.e. the low lying coasts built on unconsolidated sediments, are valuable ecosystems by themselves; they also, front/protect various other important back-barrier environments/ecosystems Beaches protect very important coastal economic assets/infrastructure and activities from marine inundation Beaches are very important assets by themselves, being the focus of the very large and lucrative ‘sun and beach’ tourist industry; islands, in particular, depend on their beaches for most of their income. Beaches are considered as particularly vulnerable to climate change, likely to bear the brunt of the adverse impacts of climate change, particularly through coastal retreat/erosion
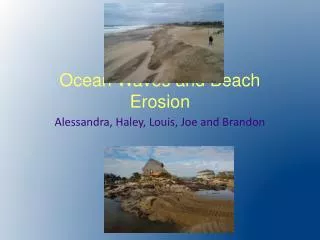
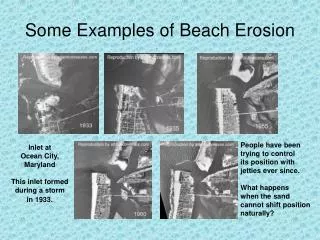
2 Beach erosion Coastal (beach) erosion, i.e. the retreat of the coastline (which may or may not be accompanied by reduction in the beach sediment volume), is a global phenomenon It can be differentiated into: • Long term erosion, i.e. non-reversible coastline retreat, occurring in long (in engineering terms) temporal scales and • Short term erosion, i.e. reversible on non-reversible retreat, occurring in short (in engineering terms) temporal scales Both can be devastating
3. Causes of beach erosion Major causes of beach erosion include: • Climatic changes (e.g. sea level rise (ASLR), changes (reduction) in precipitation and, thus, in river sediment discharges, changes in the frequency/intensity and destructiveness of storms/storm surges • Reduction in coastal sediment supply-negative sediment budgets due to e.g. river management schemes, destruction of coastal seagrass prairies that provide marine biogenic sediments to beaches and badly designed coastal works • Isostatic and tectonic movements • Natural or human –induced subsidence of coastal deltaic/estuarine sediments on which most of the large coastal cities are built (Erikson et al., 2005)
Climate change impacts on beaches One the most potent drivers of beach erosion are the climatic changes, i.e. • the sea level rise • changes (reduction) in precipitation and, thus, in river sediment discharges • changes in the frequency/intensity/destructiveness of storms/storm surges • increases in coastal water temperatures that may negatively affect natural beach defences e.g. coral reefs and seagrasses Note: Beach response to climatic changes is a non-linear process; it (mainly) depends on the magnitude/rate of sea level rise, beach slope and morphology, the impinging (and generated-infragravity) wave energy and the intensity, duration and frequency of storm surges and the nature of coastal sediments Our knowledge on these processes is still incomplete and, thus, predictions are characterised by a large uncertainty
4.1 Trends • Climate Change (CC): defined as the change of climatic conditions relative to a reference period, i.e.: • Period with first accurate records (1850s-1860s) or • Average climate of periods with accurate climatic information and associated with infrastructure used today (e.g. 1961-1990 1980-1999) • Temperature, sea level and precipitation trends • Polar Ice loss • Extreme climate events • There are also feedbacks/tipping points. Trends can be changed by reinforcing (or negative) feedbacks and if thresholds are crossed changes will not be linear and potentially reversible, but abrupt, large and (potentially) irreversible in human temporal scales (Lenton et al., 2009).
4.2 Mechanism: what are the processes involved? • Climate is controlled by solar heat inflows/outflows • A major cause of the observed increase in the planet’s heat content is the increasing atmospheric concentrations of greenhouse gases (GHGs) that absorb heat reflected back from the Earth’s surface • Variability is both natural and human- induced
4.3 The Future Predictions of future changes are characterised by uncertainty and, thus, there is a large range of predictions, Predictions depend on: • Simulations based on complex coupled atmospheric-oceanographic models • Different scenarios regarding drivers which, in turn, are controlled by different scenarios of anthropogenic factors/socio-economic behaviour • The predicted changes are region-dependent • It must be stressed that there is a lot to learn on both the ‘slow’ processes and the feedback mechanisms and the abrupt (‘catastrophic’) changes • It must be noted that (IPCC) predictions are conservative, due to (a) politics and (b) scientists’ attitude.
4.4 What scenario? • Impacts are scenario-dependent and, thus, GHG emission-dependent • These scenarios do not include ‘run-away’ climatic changes due to feedbacks/tipping points (e.g. permafrost melting, conveyor belt grinding halts and the melting of the Greenland and Antarctic ice sheets). • Major scenarios appear to be optimistic if current attitudes are taken into account (e.g. the commissioning of new coal plants) • If the BAU scenario will be the case, in 2050, global annual GDP is predicted (Stern Review 2006) to be significantly (negatively) affected (̴ 5 %) annually. .
5. Erosion costs and adaptation Few integrated, comprehensive studies on the ecological and socio-economic impacts of climate-change driven beach erosion The best studies undertaken in the US, UK and the Netherlands These studies highlight the huge socioeconomic and environmental costs of the ‘do nothing’ attitude and the large costs of the inevitable adaptation For example, it is predicted that in 2050 (at least) 124 million people and assets of 28 trillion US $ will be at risk of coastal inundation at the 136 coastal megacities The evidence suggests that we have no other choice but to get prepared for a huge adaptation effort that will be based on sound science and engineering.
Fig. 1. If beaches (and/or coastal defences) are breached, then large tracts of back-barrier ecosystems (e.g. wetlands and saltmarshes) are under a deadly threat The Netherlands disaster case (Mollema, 2009).
Coastal housing destruction, following short-term (catastrophic) beach erosion Fig. 2 S. Carolina (US) beach (c) before and (d) after a storm event in September 1996 (USGS, 1996)
Coastal transport infrastructure Sochi, S. Russia Fig. 3 The main railway line to Sochi in Black Sea will be in jeopardy, if the fronting beach would be eroded – which, will be (red line) under 1 m storm surge and offshore waves with height (H) = 4 m and period (T) = 7.9 sec.
Leont’ yev Model Present normal conditions Storm surge 1 m
US Gulf Coast inundation risk Fig.4 (a) Flood risk at US Gulf coast under sea level rise of 0-6-1.2 m (MSL+storm surge); such rise could inundate > 2400 miles of roads, > 70% of the existing port facilities, 9% of the rail lines and 3 airports. (b) In the case of a ~5.4-7 m rise (MSL+storm surge), > 50% of interstate and arterial roads, 98% of port facilities, 33% of railways and 22 airports could be affected (CCSP, 2008).
Fig. 5. Super Paradise (Mykonos). A pocket beach with very large economic potential. Economic value of Greek beaches min €1400/m/yr. This beach, €60000/m/yr.
Coastal erosion in Europe Source: Eurosion, 2004
Coastal development planning/engineering time scales must take into consideration future climate Climate Impacts EngineeringDesign Construction Potential length of service Development Planning Process ProjectConcept AdoptedLong-term Plan 0 10 20 30 50 70 80 90 100 40 60 Years Adapted from Savonis (2011)
Long-term beach erosion Fig. 7 Beach erosion since the 1945 in Morris Island, S. Carolina, US (SEPM, 1996)
L’AMELIE 3 German bunkers built in 1942 on the foredune Source J-P. Tastet
Fig. 9Nearshore bed cover and shoreline changes along Negril’s beaches (at the location of the 74 used beach profiles (RiVAMP, 2010)
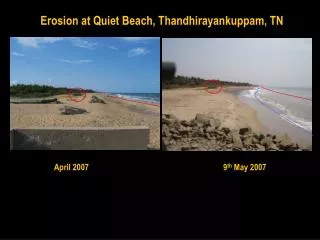
Fig.10 Long-term and short-term (catastrophic beach erosion, Eressos beach E. Mediterranean
Fig.11 Trends in total annual stream flow into Perth dams 1911–2008. (Steffen, 2009)
Fig. 12 Coastal sediment supply in the Med has been reduced from 1012 x 106 σε 355 x106 tons/yr during the second half of the 20th century due to the presence of about 3500 dams, 84% of which have been constructed during this period (Poulos et al., 2002).
Fig. 13 (a) The damand the Eressos drainage basin/beach, (c) monthly time series (2004) of (potential) sediment load (in tons) of the Eresos basin (black) and the sub-basin of the dam (white), for steady and high intensity (simulated) rainfall for 2 soil cases (i) sand soil (K=0.03) and (ii) silt soil (K=0.52). The dam witholds 52-55% of the sediments produced in the drainage basin
Fig. 14 Eressos, Lesbos, E. Med 27-2-2004. The beach, the river and the dam, which
Fig. 15 Sea level rise at Pensacola (FL) 2.14 mm/yr, Grand Isle (LA)- 9.85 mm/yr, and Galveston (TX)- 6.5 mm/yr. These trendsshow the high rates of local subsidence in Louisiana and Texas relative to the morestable geology of Florida (Savonis et al., 2008)
Fig. 16 Schema showing the beach response to sea level rise. For a sea level increase α, sediments from the shoreface are eroded and transported to the submarine section of the beach, resulting to a coastal retreat s.
Fig. 17 Mean temperature rise 1880-2010. NASA Data (Rahmstorf, 2011). Projections for 2100: - Increase 0.5 - 4.0 oC, depending on the scenario (IPCC, 2007) Fig.?? Global sea level changes 1860-2010 (Rahmstorf, 2011). Projections for 2100: - 0.20 - 0.59m(IPCC, 2007) - > 1 m if the melt of Ice sheets is included (Rahmstorf, 2007) above the mean sea level of 1980-1999
Fig 18. Long term climate-induced increase in sea level (accelerated sea level rise-ASLR) is caused by the thermal expansion of the oceans and the melting of continental ice sheets (IPCC, 2007). The relationship, however is complex, particularly at a regional level
Fig. 19 • Linear trend of annual temperatures in °C per decade for 1979-2005. Areas in grey denote insufficient data. Data sets from Smith and Reynolds (2005). After IPCC (2007) • Geographic distribution of 1993-2003 trends in mean sea level (mm yr–1) based on TOPEX/ Poseidon satellite altimetry (after Cazenave and Nerem, 2004)
Fig. 20 Annual mean trends (% per century) for 1901-2005 (Grey areas- insufficient data). Time series of annual precipitation (% of mean for 1961-1990) for the different Green bars (annual), black bars (decadal variations). After IPCC (2007).
Fig. 21 (a) The decrease of Arctic sea ice: minimum extent in September 1982 and September 2007 and projections for the future late summers (2010-2030, 2040-2060 and 2070-2090) (http://maps.grida.no/go/graphic/the-decrease-of-arctic-sea-ice-minimum-extent-in-1982-and-2007-and-climate-projections-norwegian). (b) Model results/observations of sea ice loss (Rahmstorf, 2011).
Current trends: More energetic extreme waves Fig. 22Increases in the annualmean, winteraverages, mean of the highest annual waves and annualmaximasignificant wave heights at the NDBC #46005 platform (NE Pacific). The annual maximum significant wave height has increased 2.4 m! in the last 25 years. (Ruggieroetal., 2010).
Fig. 23 Predictions (estimates) showing an increase in the number of large storms (hurricanes) in the US coast (from M. Beniston, 2009).
Fig. 24 Observed and projected increasein hurricane intensity. If the increase is due to therelatively higher increase in the Atlantic SSTs relative to other oceans, then theintensity might relax to earlier levels as inter-oceanbasin SSTs equilibrate. Conversely, if the intensity is related to absolute SSTs, then evenmore intense cyclones are expected (Steffen, 2009).
Global temperature a result of energy balance Heat = solar radiation - back radiation
Trends in GHG atmospheric concentration Fig. 26Atmospheric CO2 concentration (in parts per million) during the last 11000 years (Rahmstorf, 2011) and the last 50 years. The concentrations of the CH4 and N2O (in ppb-parts ber billion) since 1978 are also shown (Richardson et al., 2009).
Climate change: Natural causes Fig. 27. Astronomical (Milankovich) cycles that force periodic increases and decreases of incoming heat to the Earth system (Zachos and Berger, 2004).
Climate change: Natural causes Fig.28.Relationship between temperature and CO2 concentration (from ice cores in the Antarctic, Petit et al., 1999) with the astronomical cycles
Climate change: Anthropogenic causes Fig. 29Tempearture/CO2 concentration increase in the northern hemisphere in the last 1000 years. Note the large and accelerating increase since the industrial revolution (e.g. Mann and Jones, 2003; Zachos and Berger, 2004).
Climate change: Natural and anthropogenic Fig. 30 Diagnosis/prognosis from climatic models (Hadley Centre for Climate Prediction, UK) which show the combined natural/anthropogenic control on temperature; only combined forcing results in aggreemnt between moels and observations ((Mann and Jones, 2003).
Fig. 27 Temperature anomalies with respect to 1901-1950 for 6 oceanic regions for (a) 1906-2005 (black line) and as simulated by known forcings; and (b) as projected for 2001-2100 for the A1B scenario (orange envelope). The bars at the end of the orange envelope represent the range of projected changes for 2091-2100 for the B1 scenario (blue), the A1B scenario (orange) and the A2 scenario (red). Black line is dashed where observations are present for less than 50% of the area in the decade concerned.
Fig. 28 Global mean sea level (relative to the 1980-1999 mean) in the past and future (grey shading shows past uncertainty). The red line from tide gauges (red shading shows variation range). The green line shows global mean sea level observations from satellite altimetry. Blue shading represents the range of model projections for the 21st century, relative to the 1980-1999 mean. Emissions scenario?. More recent research (2008-2011) shows that we may have underestimated the trends by a factor of 2.5-3.