Download
1 / 24
240 likes | 432 Vues
Proposal for the Investigation of Sandy Beach Erosion. A Case Study on Yilan, Taiwan. by Department of Geography Associate Professor Hsueh-Mei Joyce Lin Research Assistant Ming-Jen Frank Chu. Outline. Introduction Previous study Purpose Hypothesis Study Areas Data Manipulation Results

E N D
Proposal for the Investigation of Sandy Beach Erosion A Case Study on Yilan, Taiwan by Department of Geography Associate Professor Hsueh-Mei Joyce Lin Research Assistant Ming-Jen Frank Chu
Outline • Introduction • Previous study • Purpose • Hypothesis • Study Areas • Data Manipulation • Results • Grid Analysis • Final Products – DEMs • Conclusion
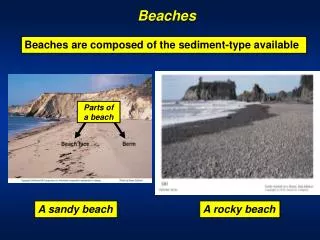
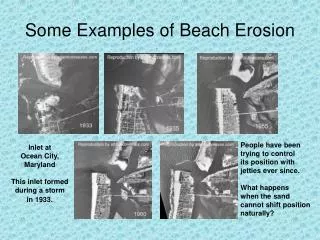
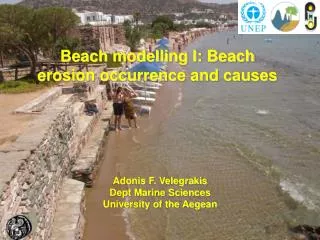
Introduction • The sediment and gravels from Taiwan’s steep mountains and short rivers always provide a great source for supporting the island’s sandy beach formation. In the past decades, several coastal development projects have been completed and have interrupted the balance of the transport. River improvement constructions also reduce the sand and gravels coming to the shore. These facts are causing Taiwan’s sandy beach erosion. • Previous Study..
Previous Study • You (1993) first claimed that several sections of Yilan shoreline have been retreating for 0.96 meter annually from 1919 until 1987, and 7.9 meters from 1979 until 1985. • Report from First River Management Office (2002) pointed out that Yilan’s coast has eroded by tidal wave in the past decade. • Chen et al. (2004) ran an analysis based on cross section histograms from FRMO, and discovered that majority of Yilan’s coast is eroding. • Hsu’s (2005) study shows that the northern arc of Yilan coast is in its erosion process, especially in serious areas such as Dafu and Touchen.
Summary • Long-term study – You (1993) and Hsu (2005)’s studies show that northern arc of Yilan coast is in erosion process; however, southern arc is in deposition process. • Short-term study – Chen (2005) and First River Management Office (2005) discovered Yilan coast overall is in erosion process.
Purpose • Previous related researches mostly focus on the adjustment of water line or area. Derive from the studies, this research will emphasize on the volume change throughout the short-term time range. Three beaches on Yilan’s coast have been selected, the GIS-based procedures will be integrated and to generate DTM for volume comparison and thus will support whether these areas are in its erosion or deposition process.
Hypothesis • The formation of the sandy beach in Yilan requires both the sufficient sediment from Lanyang River and the energy of longshore current. • The construction of river improvement, conservation of water and soil, sand/gravel mining reduce the volumes of sedimentation of Lanyang River.
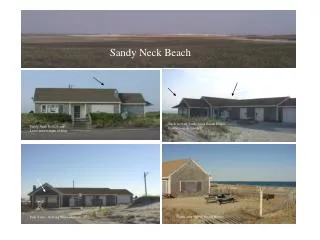
Waiao Beach Dingliao Beach Wuweikung Beach StudyArea
Data Manipulation • Data Resource • Select – To select the most applicable data layer. • Edit – Topologically edit the attributes. • Krige – Interpolate the attributes into DTM. • Clip – Select the desired area for calculation. • Conversion – Convert the DTMs into TINs.
Resource • F.R.M.O. • 5 sub files • Annotation • Patch • Polyline • Polygon • Point • 69 layers • Human structures • Land Survey • Landscape • Nearly 50,000 records
Selecting • Qualification • Be able to show the location • Must have elevation • Have to be consistent
Editing & Kriging • Rules • Can not overlap • Can not be overlapped • Kriging
Clipping Cut the desired areafor conversion.
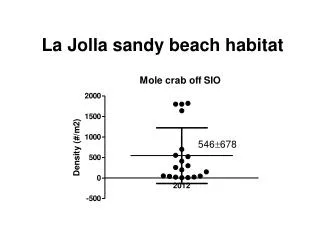
Results The surface area is measured along the slope of the surface; it takes the variation in the height of the surface into account. The volume is the space between the surface and a reference plane set at a particular height.
Grid Analysis • Difference = Before – After
Next • Q1 finished, before/after typhoon quarters, and Q4. • To calculate waterline & area change rates. • To set up Beach degradation indicators. • To gather and introduce tides, waves data.
Conclusion • This presentation demonstrates a method to detect onshore adjustment, and the volume change numbers are based on the best available data at the time of preparation. Updates to the DTM will be performed as new data becomes available.
Thank you foryour participation. Ming-Jen Frank Chu fc713@hotmail.com