Leveraging ESIP Data-Type Ontology for Visualization Support
Explore modeling relationships between tasks and operators for visualization, utilizing an Ontology Web Language. Use geometric concepts from ESIP ontology to represent views. Evaluate language for describing visualization processes across toolkits.

Leveraging ESIP Data-Type Ontology for Visualization Support
E N D
Presentation Transcript
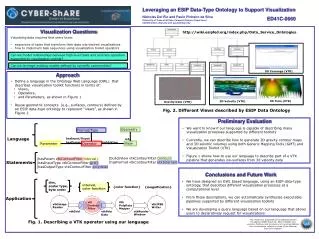
Leveraging an ESIP Data-Type Ontology to Support Visualization Nicholas Del Rio and Paulo Pinheiro da Silva University of Texas at El Paso Computer Science Department ndel2@miners.utep.edu and paulo@utep.edu ED41C-0660 www.scidesign.org Visualization Questions http://wiki.esipfed.org/index.php/Data_Service_Ontologies • Visualizing data requires that users know: • sequences of tasks that transform their data into desired visualizations • how to implement task sequences using visualization toolkit operators • Can we model relationships between high level tasks and concrete operators supported by visualization toolkits? • Can we leverage existing models defined by scientific communities? 3D Coverage (VTK) Approach • Define a language in the Ontology Web Language (OWL) that describes visualization toolkit functions in terms of: • Views, • Operators, • and Parameters, as shown in Figure 1 • Reuse geometric concepts (e.g., surfaces, contours) defined by an ESIP data-type ontology to represent “views”, as shown in Figure 2 3D Time (VTK) 3D Velocity (VTK) Gravity Data (VTK) Fig. 2. Different Views described by ESIP Data Ontology Preliminary Evaluation • We want to know if our language is capable of describing many visualization processes supported by different toolkits • Currently, we can describe how to generate 2D gravity contour maps and 3D seismic volumes using both Generic Mapping Tools (GMT) and Visualization Toolkit (VTK) • Figure 1 shows how to use our language to describe part of a VTK pipeline that generates iso-surfaces from 3d velocity data Geometry Format/Type Language hasInput/Ouput isA hasParam buildsView View Operator Parameter (buildsViewvtkContourFilter contour) (hasFormatvtkContourFiltervtkInternal) (hasParamvtkContourFilter interval) (hasInputTypevtkContourFilter grid) (hasOutputTypevtkContourFilterpolydata) Statements Conclusions and Future Work • We have designed an OWL based language, using an ESIP data-type ontology, that describes different visualization processes at a computational level • From these descriptions, we can automatically synthesize executable pipelines supported by different visualization toolkits • We are developing a query language based on our language that allows users to declaratively request for visualizations dim, scalar type, byte order interval, color function {color function} {magnification} Application vtk Contour Filter Vtk PolyData Mapper vtkJPEG Writer vtkImage Reader vtkRender Window vtkPolyData vtkGrid This research is supported by the National Science Foundation CREST Grant No. HRD-0734825. Any opinions, findings, and conclusions or recommendations do not necessarily reflect the views of the National Science Foundation. Fig. 1. Describing a VTK operator using our language