Download
1 / 10
100 likes | 195 Vues
The QD display segment holds the major share of 44% in the global quantum dots market in 2016; whereas QD solar cells segment is expected to increase with a considerable CAGR in the coming years.

E N D
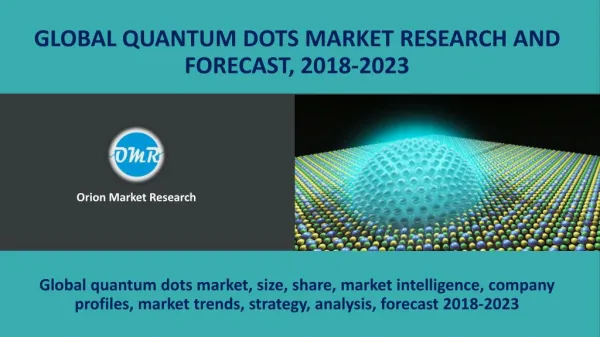
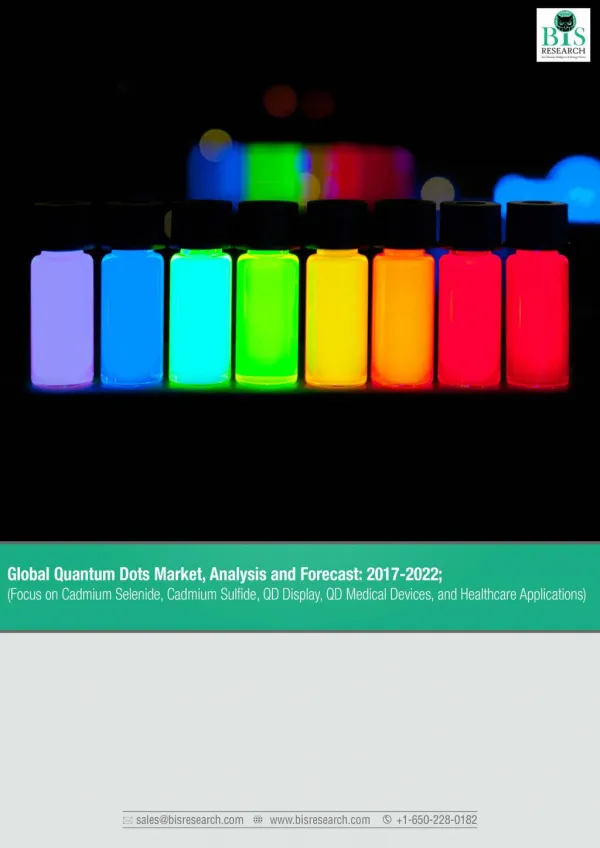
Global Quantum Dots Market, Analysis and Forecast: 2017-2022; (Focus on Cadmium Selenide, Cadmium Sulfide, QD Display, QD Medical Devices, and Healthcare Applications) The future global economy is expected to consume more energy, especially with the growing energy demand from the developing countries, such as China and India. Additionally, the risk of climate change associated with the use of fossil fuels, has made supply of energy increasingly difficult. The quantum dots market is expected to grow at a significant rate during the forecast period. The market is estimated to witness growth at a CAGR of 46.4% over the period of 2016 to 2022. This is due to the growing demand of quantum dots from developing countries which is providing ample growth opportunities for quantum dots market. Growing demand of quantum dots in display devices and energy efficiency offered by quantum dots are some of the factors driving the growth of quantum dots market. However, slower adoption of the technology and utilization of heavy metals as raw material are restraining the growth of the global quantum dots market. North America led the global quantum dots market in 2016 followed by Europe. Asia Pacific quantum dots market is expected to grow with the highest rate during the forecast period and overtake the position of Europe in global quantum dots market. Asia Pacific is still an emerging market for quantum dots technology. However, the presence of big players in the Asia Pacific market such as Samsung Electronics, Sony Corporation, and LG is expected to push the growth of quantum dots market in the Asia Pacific region. Japan and South Korea, being technologically advanced in the field of electronics and semiconductor devices, are going to drive the market in terms of technology and innovation. Partnerships, joint ventures, collaborations and contracts have emerged as preferred strategies in bringing the quantum dots market players together. The companies with similar goals are collaborating together to form joint venture programmes in order to assist each other in achieving those goals. This helps companies gain access to each other’s technologies, services and thus facilitates them to achieve their objectives faster. Some of the key players involved in this market are Evident Thermoelectrics, Invisage Technologies Inc., Nanoco Group plc, Nanosys Inc., Nn-Labs Llc, Ocean Nanotech Llc, QD Laser Inc., QD Vision Inc., Quantum Material Corporation, and Merck KGaA. The report is a compilation of different segments of global quantum dots market including a market breakdown by material, device type, and application. The report also discusses in detail about the key participants involved in the industry. It answers the following questions about the global quantum dots market: • What are the prevailing device types, and materials in quantum dots? • What are the different application areas of quantum dots? • What are the different factors driving the market forward in the forecast period? • What are the factors restraining the growth of global quantum dots market? www.bisresearch.com
Global Quantum Dots Market, Analysis and Forecast: 2017-2022; (Focus on Cadmium Selenide, Cadmium Sulfide, QD Display, QD Medical Devices, and Healthcare Applications) • Who are the major participants in the global quantum dots market? • What kind of new strategies are being adopted by the existing market players to make a stronger mark in the industry? • Which region will lead the global quantum dots market by the end of forecast period? Quantum Dots Market Size, ($Million) CAGR 46.4% XX XX XX 2016 2022 2017 www.bisresearch.com
Global Quantum Dots Market, Analysis and Forecast: 2017-2022; (Focus on Cadmium Selenide, Cadmium Sulfide, QD Display, QD Medical Devices, and Healthcare Applications) Analysis & Forecast: Base Year: 2015 Estimated Year: 2016 6 Year Annual Estimated Forecast (2016-2022) Market, by material: Cadmium Selenide, Cadmium Sulfide, Cadmium Telluride, Indium Arsenide, Silicon and Graphene Market, By Device Type: QD Medical Devices, QD Display, QD Lighting, QD Solar Cells, QD Laser and others Market, By Application: Healthcare, Consumer Application, Industrial Application and others Market, By Geography: North America (U.S., Canada and Others), Europe (Germany, U.K., France, Spain and Others), Asia-Pacific (China, India, Japan, South Korea, and Others), and Rest of the World (Latin America, and Middle East and Africa) www.bisresearch.com
Global Quantum Dots Market, Analysis and Forecast: 2017-2022; (Focus on Cadmium Selenide, Cadmium Sulfide, QD Display, QD Medical Devices, and Healthcare Applications) TABLE OF CONTENTS Executive Summary 1 Research Scope & Methodology 1.1 Scope of the Report 1.2 Quantum Dots Market Research Methodology 2 Market Dynamics 2.1 Introduction 2.2 Market Drivers 2.2.1 Growing demand of quantum dots in display devices 2.2.2 Energy efficiency offered by quantum dots 2.2.3 Miniature Property of Quantum Dot Makes It Implemented In Almost All Application 2.3 Market Restraints 2.3.1 Slower Adoption of Technology Due To Lack of Awareness among Consumers 2.3.2 Utilization of Heavy Metals as Raw Material 2.4 Market Opportunities 2.4.1 Growing Demand from Developing Countries in Future 2.4.2 Quantum Dots, a Promising Alternative to OLED Technology 2.4.3 Potential Applications in Healthcare 3 Competitive Insights 3.1 Key Strategies and Developments 3.1.1 Partnerships, Joint Ventures, Collaborations and Contracts 3.1.2 New Product Launches, Developments and Expansions 3.1.3 Other Developments 3.2 Key Player Analysis 3.3 R&D Analysis of Leading Players in Quantum Dots Market 3.4 Processing Technologies Used for Quantum Dots 3.4.1 Colloidal Synthesis 3.4.2 Viral Assembly 3.4.3 Bulk Manufacturing 3.4.4 Cadmium-free Quantum Dots–Moving Beyond Cadmium 3.4.5 Electrochemical Assembly 4 Global Quantum Dots Market by Material 4.1 Assumptions and Limitations 4.2 Introduction 5 Global Quantum Dots Market by Device Type 5.1 Introduction 5.1.1 Quantum Dot Medical Devices 5.1.1.1 QD Medical Devices by Application 5.1.1.2 QD Medical Devices by Region 5.1.2 QD Display 5.1.2.1 QD Display by Application 5.1.2.2 QD Display by Region 5.1.3 QD Lighting 5.1.3.1 QD Lighting by Application 5.1.3.2 QD Lighting by Region 5.1.4 QD Solar Cells 5.1.4.1 QD Solar Cells by Application 5.1.4.2 QD Solar Cells by Region 5.1.5 QD Laser 5.1.5.1 QD Laser by Application 5.1.5.2 QD Laser by Region 5.1.6 Others 5.1.6.1 Others by Application 5.1.6.2 Others by Region 6 Global Quantum Dots Market by Applications 6.1 Introduction 6.1.1 Healthcare 6.1.2 Consumer Application 6.1.3 Industrial Application 7 Global Quantum Dots Market by Region 7.1 Introduction 7.2 North America by Country 7.3 Europe by Country 7.4 Asia Pacific by Country 7.5 ROW by Country 8 Company Profile 8.1 Evident Thermoelectrics 8.1.1 Company Overview 8.1.2 Corporate Summary 8.2 InVisage 8.2.1 Company Overview 8.2.2 Corporate Summary 4.2.1 Cadmium Selenide 4.2.2 Cadmium Sulfide 4.2.3 Cadmium Telluride 4.2.4 Indium Arsenide 4.2.5 Graphene www.bisresearch.com
Global Quantum Dots Market, Analysis and Forecast: 2017-2022; (Focus on Cadmium Selenide, Cadmium Sulfide, QD Display, QD Medical Devices, and Healthcare Applications) TABLE OF CONTENTS 8.13 Nanoco Group PLC 8.13.1 Company Overview 8.13.2 Financials 8.13.2.1 Overall Financials 8.13.2.2 Geographic Revenue Mix 8.13.2.3 Business Segment Revenue Mix 8.13.2.4 Financial Summary 8.13.3 SWOT Analysis 8.14 Samsung Electronics Co, Ltd. 8.14.1 Company Overview 8.14.2 Financials 8.14.2.1 Overall Financials 8.14.2.2 Geographic Revenue Mix 8.14.2.3 Business Segment Revenue Mix 8.14.2.4 Financial Summary 8.14.3 SWOT Analysis 8.15 OSRAM Licht AG 8.15.1 Company Overview 8.15.2 Financials 8.15.2.1 Overall Financials 8.15.2.2 Geographic Revenue Mix 8.15.2.3 Business Segment Revenue Mix 8.15.2.4 Financial Summary 8.15.3 SWOT Analysis 8.16 LG Electronics 8.16.1 Company Overview 8.16.2 Financials 8.16.2.1 Overall Financials 8.16.2.2 Business Segment Revenue Mix 8.16.2.3 Financial Summary 8.16.3 SWOT Analysis 8.17 Pacific Light Technologies Corp. 8.17.1 Company Overview 8.17.2 Corporate Summary 8.18 Fuji Pigment Company 8.18.1 Company Overview 8.18.2 Corporate Summary 9 Appendix 9.1 Discussion Guide 9.2 List of Secondary Sources 9.3 Expert Interviews Excerpt 9.4 BIS Capability in Semiconductor Domain 8.12.1 Company Overview 8.12.2 Corporate Summary 8.3 Nanoco Group PLC 8.3.1 Company Overview 8.3.2 Financials 8.3.2.1 Overall Financials 8.3.2.2 Geographic Revenue Mix 8.3.2.3 Business Segment Revenue Mix 8.3.2.4 Financial Summary 8.3.3 SWOT Analysis 8.4 Nanosys Inc. 8.4.1 Company Overview 8.4.2 Corporate Summary 8.5 NN-Labs, LLC 8.5.1 Company Overview 8.5.2 Corporate Summary 8.6 Ocean NanoTech 8.6.1 Company Overview 8.6.2 Corporate Summary 8.7 QD Laser, Inc. 8.7.1 Company Overview 8.7.2 Corporate Summary 8.8 QD Vision, Inc. 8.8.1 Company Overview 8.8.2 Corporate Summary 8.9 Quantum Materials Corp. 8.9.1 Company Overview 8.9.2 Financials 8.9.2.1 Overall Financials 8.9.3 Corporate Summary 8.10 Merck KGaA 8.10.1 Company Overview 8.10.2 Financials 8.10.2.1 Overall Financials 8.10.2.2 Geographic Revenue Mix 8.10.2.3 Business Segment Revenue Mix 8.10.2.4 Financial Summary 8.10.3 SWOT Analysis 8.11 Sony Corporation 8.11.1 Company Overview 8.11.2 Financials 8.11.2.1 Overall Financials 8.11.2.2 Geographic Revenue Mix 8.11.2.3 Business Segment Revenue Mix 8.11.2.4 Financial Summary 8.11.3 SWOT Analysis 8.12 Crystalplex Corporation www.bisresearch.com
Global Quantum Dots Market, Analysis and Forecast: 2017-2022; (Focus on Cadmium Selenide, Cadmium Sulfide, QD Display, QD Medical Devices, and Healthcare Applications) LIST OF TABLE Table 7.4 Asia Pacific Quantum Dots Market Breakdown by Country, 2015 – 2022 Table 7.5 ROW Quantum Dots Market Breakdown by Country, 2015–2022 Table 2.1 Ranking of Metals Based on Dangers Caused Table 2.2 Ranking of Top Countries Based on their Standard of Living Table 3.1 Partnerships, Joint Ventures, Collaborations and Contracts Table 3.2 New Product Launches, Developments and Expansions Table 3.3 Other Developments Table 3.4 Major Players in the Quantum Dots Market Table 4.1 Global Quantum Dots Market by Materials, (2016-2022) Table 5.1 Global Quantum Dots Market by Materials, (2016-2022) Table 5.2 Global QD Medical Devices Market Breakdown by Region, 2016 – 2022 Table 5.3 Global QD Display Market Breakdown by Application, 2016–2022 Table 5.4 Global QD Display Market Breakdown by Region, 2016–2022 Table 5.5 Global QD Lighting Market Breakdown by Application, 2016–2022 Table 5.6 Global QD Lighting Market Breakdown by Region, 2016–2022 Table 5.7 Global QD Solar Cells Market Breakdown by Application, 2016–2022 Table 5.8 Global QD Solar Cells Market Breakdown by Region, 2016–2022 Table 5.9 Global QD Laser Market Breakdown by Application, 2016–2022 Table 5.10 Global QD Laser Market Breakdown by Region, 2016–2022 Table 5.11 Global Others Market Breakdown by Application, 2016–2022 Table 5.12 Global Others Segment Market Breakdown by Region, 2016–2022 Table 6.1 Global Quantum Dots Market Breakdown by Application, 2016–2022 Table 7.1 Global Quantum Dots Market Breakdown by Region, 2016–2022 Table 7.2 North America Quantum Dots Market Breakdown by Country, 2015–2022 Table 7.3 Europe Quantum Dots Market Breakdown by Country, 2015 – 2022 www.bisresearch.com
Global Quantum Dots Market, Analysis and Forecast: 2017-2022; (Focus on Cadmium Selenide, Cadmium Sulfide, QD Display, QD Medical Devices, and Healthcare Applications) LIST OF FIgurES Figure 5.5 QD Display Devices Shipments Figure 5.6 QD Display by Application Figure 5.7 QD Display by Region Figure 5.8 QD Lighting Market Figure 5.9 QD Lighting by Application Figure 5.10 QD Lighting by Region Figure 5.11 QD Solar Cells Market Figure 5.12 QD Solar Cells by Application Figure 5.13 QD Display by Region Figure 5.14 QD Laser Market Figure 5.15 QD Laser by Application Figure 5.16 QD Laser by Region Figure 5.17 Other QD Device Type Market Figure 5.18 Others by Application Figure 5.19 Others Segment by Region Figure 6.1 Global Quantum Dots Market Segmentation by Application Figure 6.2 Global Quantum Dots Market by Application Figure 6.3 Quantum Dot Market Revenue Generated from Healthcare Application Figure 6.4 Quantum Dot Market Revenue Generated from Consumer Application Figure 6.5 Quantum Dot Market Revenue Generated from Industrial Application Figure 7.1 Global Quantum Dots Market by Region Figure 7.2 Global Quantum Dots Market by Region Figure 7.3 Quantum Dots by Region Figure 7.4 Regional Quantum Dots Market Share by Device Type Figure 7.5 Regional Quantum Dots Market by Device Type Figure 7.6 North America Quantum Dots Market by Country Figure 7.7 Europe Quantum Dots Market by Country Figure 7.8 Asia Pacific Quantum Dots Market by Country Figure 7.9 ROW Quantum Dots Market by Country Figure 1 Quantum Dot Technology Versus OLED Figure 2 Global Quantum Dots Market Figure 3 Cadmium Selenide Market is leading among all the Materials Figure 4 Quantum Dot Display is leading among all the Device Type Figure 5 Shipments of Quantum Dots Display Figure 6 Healthcare Application of Quantum Dot Generated Maximum Revenue Figure 7 North America Leading the Global Quantum Dots Market Figure 1.1 Global Quantum Dots Market Scope Figure 1.2 Secondary data sources Figure 1.3 Top Down and Bottom up Approach Figure 1.4 Quantum Dots Market Influencing Factors Figure 1.5 Assumptions and limitations Figure 2.1 Market Dynamics Figure 2.2 Rapidly Increasing Atmospheric Carbon Dioxide Concentration (PPMV) Globally Figure 2.3 Increasing Quantum Dots Market in Healthcare Application Figure 3.1 Research and Development (R&D) Expenditure, $ Million Figure 3.2 Technologies Used for Processing Quantum Dots Figure 4.1 Global Quantum Dots Technology Market Figure 4.2 Global Quantum Dots Segmentation by Material Figure 4.3 Global Quantum Dots Market by Material Figure 4.4 Cadmium Selenide Market Figure 4.5 Cadmium Sulfide Market Figure 4.6 Cadmium Telluride Market Figure 4.7 Indium Arsenide Market Figure 4.8 Graphene Market Figure 5.1 Global Quantum Dots Market Segmentation by Device Type Figure 5.2 Global Quantum Dots Market by Device Type Figure 5.3 QD Medical Devices in Healthcare Figure 5.4 QD Medical Devices by Region www.bisresearch.com
Global Quantum Dots Market, Analysis and Forecast: 2017-2022; (Focus on Cadmium Selenide, Cadmium Sulfide, QD Display, QD Medical Devices, and Healthcare Applications) LIST OF FIgurES ($Million) Figure 8.1 Overall Financials, 2014-16 ($Million) Figure 8.2 Geographic Revenue Mix, 2014-16 ($Million) Figure 8.3 Segment Revenue Mix, 2014-16 ($Million) Figure 8.4 Nanoco Group PLC–SWOT Analysis Figure 8.5 Company’s Structure of Development Figure 8.6 Quantum Materials Corp.–Overall Financials, 2013-2015 ($Million) Figure 8.7 Overall Financials, 2014-16 ($Million) Figure 8.8 Geographic Revenue Mix, 2014-16 ($Million) Figure 8.9 Segment Revenue Mix, 2014-16 ($Million) Figure 8.10 Merck KGaA–SWOT Analysis Figure 8.11 Overall Financials, 2014-16 ($Million) Figure 8.12 Geographic Revenue Mix, 2014-16 ($Million) Figure 8.13 Segment Revenue Mix, 2014-16 ($Million) Figure 8.14 Sony Corporation–SWOT Analysis Figure 8.15 Overall Financials, 2014-16 ($Million) Figure 8.16 Geographic Revenue Mix, 2014-16 ($ Million) Figure 8.17 Segment Revenue Mix, 2014-16 ($Million) Figure 8.18 E. I. duPont–SWOT Analysis Figure 8.19 Overall Financials, 2014-16 ($Million) Figure 8.20 Geographic Revenue Mix, 2014-16 ($ Million) Figure 8.21 Segment Revenue Mix, 2014-16 ($ Million) Figure 8.22 Samsung Electronics Corporation– SWOT Analysis Figure 8.23 Overall Financials, 2014-16 ($Million) Figure 8.24 Geographic Revenue Mix, 2014-16 ($Million) Figure 8.25 Segment Revenue Mix, 2014-16 ($Million) Figure 8.26 OSRAM Licht AG–SWOT Analysis Figure 8.27 Overall Financials, 2014-16 Figure 8.28 Segment Revenue Mix, 2014-16 ($Million) Figure 8.29 LG Electronics–SWOT Analysis www.bisresearch.com
Global Quantum Dots Market, Analysis and Forecast: 2017-2022; (Focus on Cadmium Selenide, Cadmium Sulfide, QD Display, QD Medical Devices, and Healthcare Applications) DISCLAIMEr BIS Research provides valuable market intelligence to an exclusive group of customers in response to orders. The report is licensed for the customer’s internal use only and is subject to restrictions set henceforth. This document and its contents are confidential and may not be further distributed, published or reproduced, in whole or in part, by any medium or in any form for any purpose, without the express written consent of BIS Research. Customer will not disclose the contents of the report, whether directly in any media or indirectly through incorporation in a database, marketing list, report or otherwise, or use or permit the use of Information to generate any statistical or other information that is or will be provided to third parties; or voluntarily produce Information in legal proceedings. Market reports are based on expectations, estimates and projections as of the date such information is available. Any recommendation contained in this report may not be suitable for all investors or businesses. The market conclusions drawn are necessarily based upon a number of estimates and assumptions that, while considered reasonable by BIS Research as of the date of such statements, are inherently subject to market fluctuations and business, economic and competitive uncertainties and contingencies. For more details regarding permission, please contact us: Email: sales@bisresearch.com Tel: +1 650 228 0182 www.bisresearch.com