Quantum Dots Market
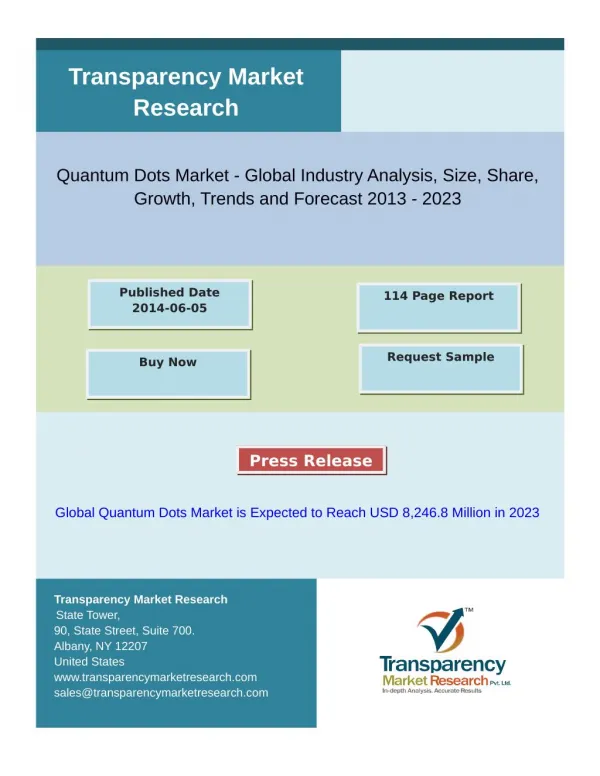
<br>According to a new market report published by Transparency Market Research (www.transparencymarketresearch.com) “Quantum Dots Market - Global Industry Analysis, Size, Share, Growth, Trends and Forecast, 2013 - 2023,” the market was valued at USD 88.5 million in 2011, which is expected to reach USD 8,246.8 million by 2023, growing at a CAGR of 53.8% from 2013 to 2023.<br>

Quantum Dots Market
E N D
Presentation Transcript
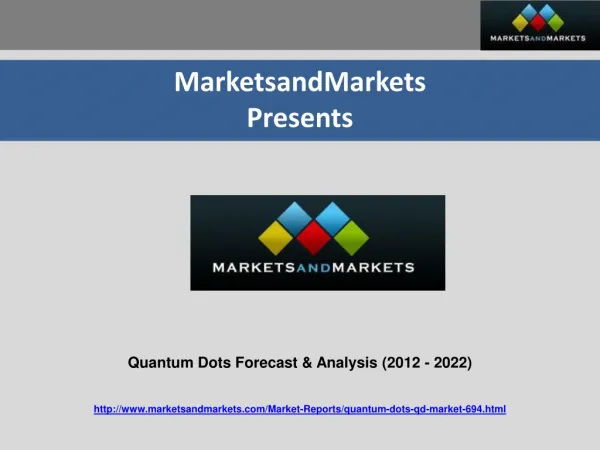
Transparency Market Research Quantum Dots Market - Global Industry Analysis, Size, Share, Growth, Trends and Forecast 2013 - 2023 Published Date 2014-06-05 114 Page Report Request Sample Buy Now Press Release Global Quantum Dots Market is Expected to Reach USD 8,246.8 Million in 2023 Transparency Market Research State Tower, 90, State Street, Suite 700. Albany, NY 12207 United States www.transparencymarketresearch.com sales@transparencymarketresearch.com
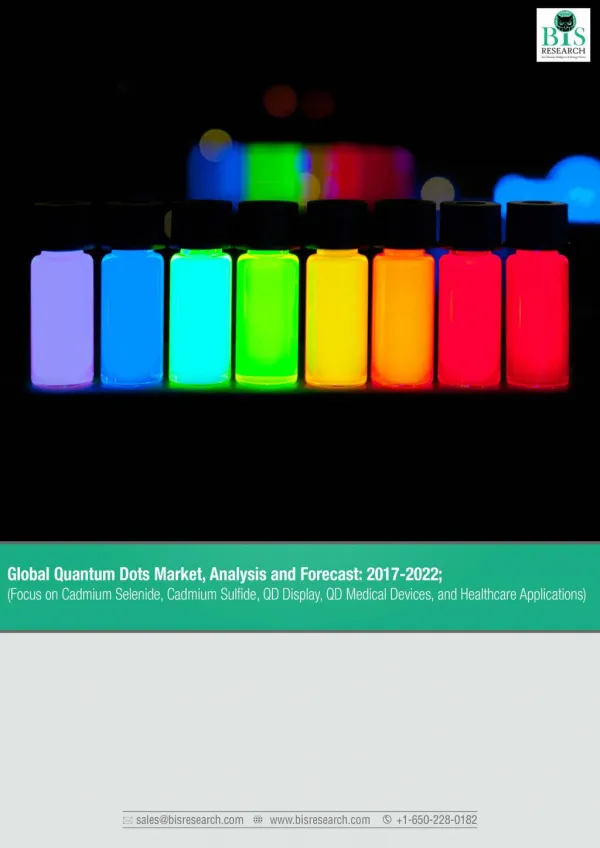
Quantum Dots Market REPORT DESCRIPTION According to a new market report published by Transparency Market Research (www.transparencymarketresearch.com) “Quantum Dots Market - Global Industry Analysis, Size, Share, Growth, Trends and Forecast, 2013 - 2023,” the market was valued at USD 88.5 million in 2011, which is expected to reach USD 8,246.8 million by 2023, growing at a CAGR of 53.8% from 2013 to 2023. Browse the full report at http://www.transparencymarketresearch.com/quantum- dots.html Increasing demand for energy efficient displays and lighting solutions is the major force driving the quantum dots market. In the field of electroluminescent displays, light emitting quantum dots are preferred for next generation displays as they offer improved color purity, brighter images, and energy efficiency. In addition, regulated demand from healthcare sector is expected to have positive impact on the demand of quantum dots over the forecast period. This can be attributed to the increasing use of quantum dots in wide range of medical applications including drug delivery, cell tracking, and biological imaging among others. The use of quantum dots in solar cells and VLSI (Very Large Scale Integration) design is expected to open new possibilities for quantum dots market in coming years. Healthcare segment accounted for 77.4% of the overall revenue in 2012. However, optoelectronics segment is expected to surpass the healthcare quantum dots market, growing at the fastest CAGR of 71.5% from 2013 to 2023. Superior capabilities in terms of operating life, energy efficiency, and color quality of the emitted light make quantum dots preferred technology to be used in displays and lighting solutions. In addition, unique optical properties exhibited by quantum dots have made them attractive semiconducting material. In terms of products, the QD medical device segment held the highest market share, and was valued at approximately USD 68.5 million in 2012. The QD LED display segment is expected to grow at the highest CAGR of 85.4% from 2013 to 2023 due to tremendous growth expected in optoelectronics segment. North America was the market leader in 2012, and Asia Pacific is expected to be the fastest growing region, with an expected CAGR of 55.4% from 2013 to 2023. The growth in the region is attributed to growing demand from solar energy and optoelectronics application segments. 2 Transparency Market Research
Quantum Dots Market Browse the full Press Release : http://www.transparencymarketresearch.com/pressrelease/quantum-dots-market.htm Major industry participants include Life Technologies Corporation (U.S.), QD Vision, Inc. (U.S.), Nanosys, Inc. (U.S.), Nanoco Technologies Ltd (U.K.), Ocean NanoTech LLC (U.S), QD Laser, Inc. (Japan), and Quantum Material Corporation (U.S.) among others. The report studies the global quantum dots market, and provides estimates in terms of revenue (USD Million) from 2013 to 2023. Market estimates on the basis of application, product type, and raw materials; have also been provided for each region. The market has been segmented as follows: Quantum Dots Market, by Application Health Care Flow Cytometry Biological imaging (in-vitro, in-vivo, and so on) Drug Delivery Cell Tracking Photodynamic Theory Quantum Computing Optoelectronics Quantum Optics Security & Surveillance Energy Quantum Dots Market, by Products: QD Medical Devices QD LED Displays QD Lasers 3 Transparency Market Research
Quantum Dots Market QD Solar Cells QD Chips QD Sensors QD Lighting Quantum Dots Market, by Raw materials Cadmium Selenium Cadmium Tellurium Non Toxic (Cadmium Free) Others (InAs, InGaAs, PbS, and so on) Quantum Dots Market, by Geography: North America Europe Asia Pacific Rest of the World (Latin America, Middle East and Africa) Request a Sample of this Report : http://www.transparencymarketresearch.com/sample/sample.php? flag=S&rep_id=1004 Table of Contents Chapter 1 Preface 1.1 Report description 1.2 Market segmentation 1.4 Research methodology 4 Transparency Market Research
Quantum Dots Market Chapter 2 Executive Summary Chapter 3 Quantum Dots Market Overview 3.1 Introduction 3.2 Trends and future outlook 3.3 Market dynamics 3.3.1 Drivers 3.3.1.1 Energy efficient technology 3.3.1.2 Growing demand for energy efficient displays and lighting applications 3.3.1.3 Regulated demand from healthcare segment 3.3.1.4 Miniaturization property 3.3.2 Restraints 3.3.2.1 Volume manufacturing problems and investments in competing technologies 3.3.2.2 Toxicity and restricted use of heavy materials 3.3.3 Opportunities 3.3.3.1 Penetration in optoelectronics and solar energy segments 3.3.3.1.1 Optoelectronics 3.3.3.1.2 Solar energy 3.3.3.2 Increasing scope in VLSI designs 3.4 Value chain analysis 3.5 Porters five force analysis 3.5.1 Bargaining power of suppliers 3.5.2 Bargaining power of buyers 5 Transparency Market Research
Quantum Dots Market 3.5.3 Threat of substitute products 3.5.5 Degree of competition 3.6 Market share analysis, 2012 3.7 Market attractiveness analysis by end-use, 2012 Chapter 4 QD Technology: Assembly & Fabrication Analysis 4.1 Introduction 4.2 Types of fabrication techniques 4.2.1 Lithography 4.2.1.1 Electron beam lithography 4.2.1.2 Soft lithography 4.2.1.3 Stencil lithography 4.2.2 Colloidal synthesis 4.2.3 Epitaxy 4.2.4 Others 4.2.4.1 Viral assembly 4.2.4.2 Nanolithography 4.2.4.3 Electrochemical assembly 4.3 Bulk manufacture Chapter 5 Global Quantum Dots Market, by Application 5.1 Introduction 5.1.1 Quantum dots market, by application 2012 & 2023 (%) 5.2 Healthcare 6 Transparency Market Research
Quantum Dots Market 5.2.1 Healthcare quantum dots market size and forecast, 2011 - 2023 (USD million) 5.2.1.1 Flow cytometry 5.2.1.2 Biomedical imaging (in-vivo, in-vitro, tissue mapping, and so on) 5.2.1.3 Drug delivery 5.2.1.4 Cell tracking 5.2.1.5 Photodynamic therapy 5.3 Optoelectronics 5.3.1 Optoelectronics quantum dots market size and forecast, 2011 - 2023 (USD million) 5.4 Energy 5.4.1 Energy quantum dots market size and forecast, 2011 - 2023 (USD million) 5.5 Quantum computing 5.5.1 Quantum computing quantum dots market size and forecast, 2011 - 2023 (USD million) 5.6 Quantum optics 5.6.1 Quantum optics quantum dots market size and forecast, 2011 - 2023 (USD million) 5.7 Security and surveillance 5.7.1 Security and Surveillance quantum dots Market, 2011 - 2023 (USD million) Chapter 6 Global Quantum Dots Market, By Products 6.1 Introduction 6.2 QD medical devices 6.2.1 QD medical devices market size and forecast, 2011 - 2023 (USD million) 6.3 QD lasers 6.3.1 QD laser market size and forecast, 2011 - 2023 (USD million) 6.4 QD sensors 7 Transparency Market Research
Quantum Dots Market 6.4.1 QD sensors market size and forecast, 2011 - 2023 (USD million) 6.5 QD chips 6.5.1 QD chips market size and forecast, 2011 - 2023 (USD million) 6.6 QD lighting devices 6.6.1 QD lighting devices market size and forecast, 2011 - 2023 (USD million) 6.7 QD LED display 6.7.1 QD LED display market size and forecast, 2011 - 2023 (USD million) 6.8 QD solar cells 6.8.1 QD solar cell market size and forecast, 2011 - 2023 (USD million) Chapter 7 Global Quantum Dots Market, by Raw Materials 7.1 Introduction 7.1.1 Quantum dots market, by raw materials 2012 & 2023 (%) 7.2 Cadmium selenium (CdSe) 7.2.1 Cadmium selenium quantum dots market size and forecast, 2011 - 2023 (USD million) 7.3 Cadmium tellurium 7.3.1 Cadmium tellurium quantum dots market size and forecast, 2011 - 2023 (USD million) 7.4 Non-toxic raw materials (Cadmium free) 7.4.1 Non-toxic (cadmium free) quantum dots market size and forecast, 2011 - 2023 (USD million) 7.5 Others 7.5.1 Others (InAs, InP, PbS, etc.) quantum dots market size and forecast, 2011 - 2023 (USD million) Chapter 8 Global Quantum Dots Market, by Geography 8.1 Introduction 8 Transparency Market Research
Quantum Dots Market 8.2 North America 8.2.1 North America quantum dots market size and forecast, 2011 - 2023 (USD million) (million grams) 8.2.2 North America quantum dots market, by application, 2012 – 2023 (USD million) 8.2.3 North America quantum dots market, by products, 2012 – 2023 (USD million) 8.2.4 North America quantum dots market, by raw materials, 2012 – 2023 (USD million) 8.3 Europe 8.3.1 Europe quantum dots Market, 2011 - 2023 (USD million) (million grams) 8.3.2 Europe quantum dots market, by application, 2012 – 2023 (USD Million) 8.3.3 Europe quantum dots market, by products, 2012 – 2023 (USD Million) 8.3.4 Europe quantum dots market, by raw materials, 2012 – 2023 (USD Million) 8.4 Asia Pacific 8.4.1 Asia Pacific quantum dots market, 2011 - 2023 (USD million) (million grams) 8.4.2 Asia-Pacific quantum dots market, by application, 2012 – 2023 (USD Million) 8.4.3 Asia Pacific quantum dots market, by products, 2012 – 2023 (USD million) 8.4.4 Asia Pacific quantum dots market, by raw materials, 2012 – 2023 (USD million) 8.5 RoW 8.5.1 RoW quantum dots market, 2011 - 2023 (USD million)(Million grams) 8.5.2 RoW quantum dots market, by application, 2012 – 2023 (USD million) 8.5.3 RoW quantum dots market, by products, 2012 – 2023 (USD million) 8.5.4 RoW quantum dots market, by raw materials, 2012 – 2023 (USD million) Chapter 9 Company Profiles 9.1 Life Technologies Corporation 9.1.1 Company overview 9 Transparency Market Research
Quantum Dots Market 9.1.2 Financial Overview 9.1.3 Business strategies 9.1.3.1 Research and development 9.1.3.2 Mergers and acquisitions 9.1.4 Recent developments 9.2 QD Vision, Inc. 9.2.1 Company overview 9.2.2 Financial overview 9.2.3 Business strategies 9.2.4 Recent developments 9.3 Nanosys, Inc. 9.3.1 Company overview 9.3.2 Financial overview 9.3.3 Business strategies 9.3.3.1 Inorganic expansion 9.3.4 Recent developments 9.4 Nanoco Technologies Ltd. 9.4.1 Company overview 9.4.2 Financial overview 9.4.3 Business strategy 9.4.3.1 Use of Cadmium-Free quantum dots 9.4.3.2 Expansion through mergers and licensing 9.4.4 Recent Developments 9.5 QD Laser, Inc. 10 Transparency Market Research
Quantum Dots Market 9.5.1 Company overview 9.5.2 Financial overview 9.5.3 Business strategy 9.5.3.1 Strengthening of product portfolio leading to penetration in different markets 9.5.3.2 Reinforcing technology development 9.5.4 Recent developments 9.6 Ocean NanoTech LLC 9.6.1 Company overview 9.6.2 Financial overview 9.6.3 Business strategy 9.6.3.1 New product development 9.6.3.2 Focus of research and development 9.6.4 Recent Developments 9.7 Evident Technologies, Inc. 9.7.1 Company overview 9.7.2 Financial overview 9.7.3 Business strategy 9.7.4 Recent Developments 9.8 NanoAxis LLC 9.8.1 Company overview 9.8.2 Financial overview 9.8.3 Business strategy 9.8.3.1 Business expansion by partnerships and joint ventures: 9.8.3.2 Cost effective production: 11 Transparency Market Research
Quantum Dots Market 9.8.4 Recent developments 9.9 LG Display Co. Ltd. 9.9.1 Company overview 9.9.2 Financial overview 9.9.3 Business strategy 9.9.3.1 Product differentiation 9.9.3.2 Focus on futuristic technologies 9.9.4 Recent developments 9.10 Samsung Electronics Co. Ltd. 9.10.1 Company overview 9.10.2 Financial overview 9.10.3 Business strategies 9.10.3.1 Inorganic expansion 9.10.3.2 Focus on research and development 9.10.4 Recent developments 9.11 Quantum Materials Corporation 9.11.1 Company overview 9.11.2 Business strategies 9.11.2.1 Scale up quantum dot production 9.11.2.2 Focus on technological advanced products 9.11.2.3 Focus on research and development 9.11.3 Recent developments 9.12 InVisage Technologies, Inc. 9.12.1 Company overview 12 Transparency Market Research
Quantum Dots Market 9.12.2 Financial overview 9.12.3 Business strategies 9.12.4 Recent developments 9.13 NN-Labs, LLC 9.13.1 Company overview 9.13.2 Financial overview 9.13.3 Business strategies 9.13.3.1 Strategic alliance and scaling-up production 9.13.4 Recent developments List of Figures FIG. 1 Market segmentation: Global market FIG. 2 Global quantum dots market, 2011 – 2023 (USD million) (million grams) FIG. 3 Value Chain Analysis FIG. 1 Quantum Dots: Porters five forces analysis FIG. 2 Market share analysis, by key players 2012 (%) FIG. 3 Market attractiveness analysis, by end use 2012 FIG. 4 Major quantum dots fabrication techniques FIG. 5 Quantum dots market, by application 2012 & 2023 (%) FIG. 6 Healthcare quantum dots market size and forecast, 2011 - 2023 (USD million) FIG. 7 Optoelectronics quantum dots market size and forecast, 2011 - 2023 (USD million) FIG. 8 Energy quantum dots market size and forecast, 2011 - 2023 (USD million) FIG. 9 Quantum computing quantum dots market size and forecast, 2011 - 2023 (USD million) FIG. 10 Quantum optics quantum dots market size and forecast, 2011 - 2023 (USD million) 13 Transparency Market Research
Quantum Dots Market FIG. 11 Security and surveillance quantum dots market size and forecast, 2011 - 2023 (USD million) FIG. 12 QD medical devices market size and forecast, 2011 - 2023 (USD million) FIG. 13 QD laser market size and forecast, 2011 - 2023 (USD million) FIG. 14 QD sensors market size and forecast, 2011 - 2023 (USD million) FIG. 15 QD chips market size and forecast, 2011 - 2023 (USD million) FIG. 16 QD lighting devices market size and forecast, 2011 - 2023 (USD million) FIG. 17 QD LED display market size and forecast, 2011 - 2023 (USD million) FIG. 18 QD solar cell market size and forecast, 2011 - 2023 (USD million) FIG. 19 Quantum dots market, by raw materials 2012 & 2023 (%) FIG. 20 Cadmium selenium quantum dots market size and forecast, 2011 - 2023 (USD million) FIG. 21 Cadmium tellurium quantum dots market size and forecast, 2011 - 2023 (USD million) FIG. 22 Non-toxic (cadmium free) quantum dots market size and forecast, 2011 - 2023 (USD million) FIG. 23 Others (InAs, InP, PbS, etc.) quantum dots market size and forecast, 2011 - 2023 (USD million) FIG. 24 Quantum dots market, by geography 2012 & 2023 (%) FIG. 25 North America quantum dots market size and forecast, 2011 - 2023 (USD million) (million grams) FIG. 26 Europe quantum dots market, 2011 - 2023 (USD million) (Million grams) FIG. 27 Asia Pacific quantum dots market, 2011 - 2023 (USD million) (Million grams) FIG. 28 RoW quantum dots market, 2011 - 2023 (USD million) (million grams) FIG. 29 Life Technologies Corporation annual revenue, 2010 – 2012 (USD million) FIG. 30 QD Vision, Inc. annual revenue, 2012 – 2013 (USD million) FIG. 31 Nanoco Technologies Ltd. revenue, 2010 – 2012 (USD million) FIG. 32 LG Display Co. Ltd. Revenue (USD billion) FIG. 33 Samsung Electronics Co. Ltd. annual revenue, 2010 – 2012 (USD billion) List of Tables 14 Transparency Market Research
Quantum Dots Market TABLE 1 Snapshot: Global quantum dots market TABLE 2 Impact analysis of drivers TABLE 3 Impact analysis of restraints TABLE 4 Global quantum dots market, by products, 2012 and 2023 (USD million and % share) TABLE 5 Comparison between conventional quantum dots and non toxic (phosphor) quantum dots TABLE 6 North America quantum dots market, by application, 2012 – 2023 (USD million) TABLE 7 North America quantum dots market, by products, 2012 – 2023 (USD million) TABLE 8 North America quantum dots market, by raw materials, 2012 – 2023 (USD million) TABLE 9 Europe quantum dots market, by application, 2012 – 2023 (USD Million) TABLE 10 Europe quantum dots market, by products, 2012 – 2023 (USD Million) TABLE 11 Europe quantum dots market, by raw materials, 2012 – 2023 (USD Million) TABLE 12 Asia-Pacific quantum dots market, by application, 2012 – 2023 (USD million) TABLE 13 Asia Pacific quantum dots market, by products, 2012 – 2023 (USD million) TABLE 14 Asia Pacific quantum dots market, by raw materials, 2012 – 2023 (USD million) TABLE 15 RoW quantum dots market, by application, 2012 – 2023 (USD million) TABLE 16 RoW quantum dots market, by products, 2012 – 2023 (USD million) TABLE 17 RoW quantum dots market, by raw materials, 2012 – 2023 (USD million) About Us Transparency Market Research (TMR) is a global market intelligence company, providing global business information reports and services. Our exclusive blend of quantitative forecasting and trends analysis provides forward-looking insight for thousands of decision makers. TMR’s experienced team of Analysts, Researchers, and Consultants, use proprietary data sources and various tools and techniques to gather and analyze information. 15 Transparency Market Research
Quantum Dots Market Our data repository is continuously updated and revised by a team of research experts, so that it always reflects the latest trends and information. With a broad research and analysis capability, Transparency Market Research employs rigorous primary and secondary research techniques in developing distinctive data sets and research material for business reports. Contact Mr. Atil Chaudhari 90 State Street, Suite 700 Albany, NY 12207 Tel: +1-518-618-1030 USA - Canada Toll Free: 866-552-3453 Email: sales@transparencymarketresearch.com Website: http://www.transparencymarketresearch.com 16 Transparency Market Research