Download
1 / 44
450 likes | 508 Vues
Explore the design and function of color television tuner circuits to receive multi-channel broadcasts with the optimal 8 MHz frequency spectrum. Learn about signal processing and circuitry to enhance viewing experience.

E N D
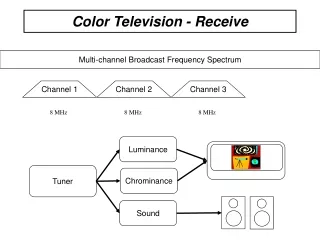
Color Television - Receive Multi-channel Broadcast Frequency Spectrum Channel 1 Channel 2 Channel 3 8 MHz 8 MHz 8 MHz Luminance Tuner Chrominance Sound
TUNER Syn Sep Color Television - Receive Y Amplifier Video Detector Syn Color Decoder U,V Figure 21
Amplifier Color Television - Decode Y R YUV TO RGB G U,V Color Decoder B V scan Syn Time Base Syn Sep H scan Figure 22
Color Television - Receive Bandwidth of TV stations are very wide – a few hundred MHz The entire Spectrum is divided into many channels Each channel has a bandwidth of around 8 MHz Building circuits to process the entire TV bandwidth is expensive A Better solution Translate the viewing channel to a fix Intermediate Frequency A circuit to process a fix bandwidth of 8 MHz will suffice
TUNER IF Stage Color Television - Receive LPF 31.5-41.5MHz 565.25-575.25 Low Pass Filter Vision Carrier IF Vision Carrier 565.25+41.5 MHz = 606.75MHz (LO)
Color Television - Receive LPF 31.5-41.5MHz 565.25-575.25 Low Pass Filter Vision Carrier IF Vision Carrier 565.25+41.5 MHz = 606.75MHz (LO) Video Spectrum Inverted Video Spectrum Noted that the downconvert process also inverted the spectrum
TUNER IF Stage Color Television - Receive 31.5-41.5MHz CH33 575.25-585.25 IF Vision Carrier Vision Carrier 575.25+41.5 MHz = 616.75MHz (LO)
Tuning and I.F. Tune f f 31.5 MHz 41.5 MHz Figure 23a f
Tuning and I.F. Tune f f 31.5 MHz 41.5 MHz Figure 24b f
Tuning and I.F. Tune f f 31.5 MHz 41.5 MHz Figure 25c f
I.F. filter response db 0 Sound 33.5MHz Vision 39.5MHz Chroma 35.07MHz Adj, vision 31.5MHz Adj, sound 41.5MHz f
TUNER IF Stage Syn Sep Color Television - Receive Y Amplifier Video Detector Syn Color Decoder U,V Figure 21
TUNER IF Stage Syn Sep Color Television - Receive Y Amplifier Video Detector Syn Color Decoder U,V Figure 21
Y U V YUV Frequency Distribution Line duration = T = 64s Line frequency = 1/T = 15.6kHz Color Subcarrier frequency fsc = 283.5/T = 4.43MHz 1/T freq 1/2T fsc 284/T Figure 26
Y-C Separation Notch Filter Supress all frequency components around the color subcarrier. Gain Y A simple method to suppress chrominance component with a notch filter. Luminance signal is suppressed as well, but it is stronger than the chrominance. fsc -100KHz +100KHz Figure 27
U-V Separation Line duration = T = 64s Line frequency = 1/T = 15.6kHz Color Subcarrier frequency fsc = 283.5/T = 4.43MHz 1/T freq Y 1/2T fsc U 284/T Figure 28 V
U V U-V Separation Line duration = T = 64s Line frequency = 1/T = 15.6kHz Color Subcarrier frequency fsc = 283.5/T = 4.43MHz fsc freq Desire Filter to Extract the V Component Figure 29
U V U-V Separation Line duration = T = 64s Line frequency = 1/T = 15.6kHz Color Subcarrier frequency fsc = 283.5/T = 4.43MHz fsc freq Desire Filter to Extract the U Component Figure 30
U V U-V Separation Line duration = T = 64s Line frequency = 1/T = 15.6kHz Color Subcarrier frequency fsc = 283.5/T = 4.43MHz fsc freq Desire Filter to Extract the U Component Figure 31
Comb Filter The ideal Filters are not available in practice Solution: Approximated by ‘Comb Filters’ Difference Output Delay Vi + -1 T = 283.5/fsc Vo1 0.5 + _ Vo2 0.5 + Sum Output Figure 32
Response of Comb Filter Sum Output f Difference Output f 283.5fsc
U V U-V Separation with Comb Filters fsc Sum Output f Difference Output f fsc = 283.5/T Figure 33
Where are We? Notch Filter Supress all frequency components around the color subcarrier. Gain Y fsc YUV -100KHz +100KHz Diff. Comb Filters U 0o Sum Comb Filters +90o V
Color Television - Receive TUNER IF Stage Y Amplifier Video Detector Syn Sep Syn Color Decoder U,V
Envelop Detector R Figure 34
Inverter Figure 35
Automatic Gain Control (AGC) Transmitted signal Amplitudes of transmitted and received signals are generally different. Automatic Gain Control (AGC) is employed to recover the original signal amplitude Received signal Figure 36
Automatic Gain Control (AGC) Transmitted signal 300mV Reference voltage obtained from syn pulse (0.7V) Received signal 150mV Figure 37 Required Amplification = 2
TUNER IF Stage Syn Sep Color Television - Receive Y Amplifier Video Detector Syn Color Decoder U,V
Automatic Gain Control (AGC) Received signal Gate Gain Control Output I.F Amplifier I.F. Video Signal Figure 38
Clamping - DC Restoration 100% brightness AMP DC 50% brightness DC Figure 39
Vi 0 -Vs Vc - + R Vi Vo = Vi -Vc Vc gradually charged to -Vs Steady State: Vo = Vi -Vc = Vi +Vs Figure 40
TUNER IF Stage Syn Sep Color Television - Receive Amplifier Y Video Detector Syn Color Decoder U,V
´ ´ U-V Demodulation cos c t (LO – Inphase component) LPF U YUV-Y Multipliers Low Pass Filters UV components only LPF V cos (c t + 90o)(LO – Quadrature component) Figure 10
Problems in U-V Demodulation • The frequency and phase of the Local Oscillators (LO) has to be identical to that in modulation • The LO and its quadrature component are not fully sent to the receiver • Only a few cycles of the LO (color burst) is included at the start of each video line
Color Subcarrier Regeneration Color Burst Detector Subcarrier Regenerator Figure 41
Basic Transformation . RGB to YUV transform Y = 0.3R + 0.59G + 0.11B U = B - Y V = R - Y YUV to RGB transform R = V + Y G = (Y - 0.3R - 0.11B)/0.59 B = U + Y Note: no Gamma correction or UV weighting
YUV-RGB R Y w1 G U w2 B V w3 Figure 41
Color Bar Patterns Useful in testing video signals and systems
Color Bar Patterns Luminance
Color Bar Patterns Chrominance
Color Bar Patterns Computing the waveform of Color Bar Patterns Chrominance magnitude = Total magnitude =
Color Bar Patterns -0.33 Y = 0.3R’ + 0.59G’ + 0.11B’ U = B’ - Y V = R’ - Y 1.33
Actual Transformation RGB to YUV transform Y = 0.3R’ + 0.59G’ + 0.11B’ U = 0.493(B’ - Y) V = 0.877(R’ - Y) R’,G’ and B’: Gamma corrected color components