ocean.washington /research/gfd/gfd.html
840 likes | 1.01k Vues
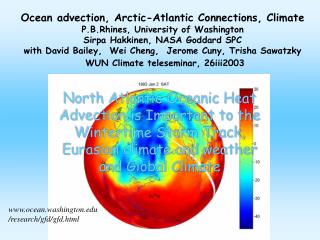
Ocean advection, Arctic-Atlantic Connections, Climate P.B.Rhines, University of Washington Sirpa Hakkinen, NASA Goddard SPC with David Bailey, Wei Cheng, Jerome Cuny, Trisha Sawatzky WUN Climate teleseminar, 26iii2003.

ocean.washington /research/gfd/gfd.html
E N D
Presentation Transcript
Ocean advection, Arctic-Atlantic Connections, ClimateP.B.Rhines, University of WashingtonSirpa Hakkinen, NASA Goddard SPCwith David Bailey, Wei Cheng, Jerome Cuny, Trisha SawatzkyWUN Climate teleseminar, 26iii2003 North Atlantic Oceanic Heat Advection is Important to the Wintertime Storm Track, Eurasian climate and weather and Global Climate www.ocean.washington.edu /research/gfd/gfd.html
TABLE OF CONTENTS • Polar amplification of global warming • Storms and weather….ocean to stratosphere: continuity of the Atlantic storm track/Icelandic Low from subtropics to Arctic • Atmospheric and oceanic transports, strongly coupled, supply continental and polar warmth, fresh water • The oceanic heat source, strongly channeled, local and imported heat: driving the 3 scales atmospheric circulation, • Transports by ocean circulation: connecting the Arctic and Atlantic • Erika Dan, 600N winter in the N Atlantic: deep, shallow and shelf water masses • Atlantic – Arctic exchange: Θ-S-transport (~heat, fresh-water transport) diagrams • Rapid and slow modes of response of Atlantic overturning: Labrador Sea vs. Nordic Sea overflows • What matters to the global overturning circulation • The freshwater cap and its movement: liquid and solid • Layering of deep-ocean water masses, and its representation in models • Shallow continental shelves and communication with the deep ocean • Arrays and instruments: establishing the baseline and sustaining it in time
Global surface temperature has seen two major warmings in the 20th Century: in the 1920s-30s, when it was very concentrated around Greenland, and since the 1980s, when it is much more global, yet still concentrated in high northern latitudes. Cod and herring fisheries responded to the much warmer ocean temperatures, which lasted for more than 25 years. Ironically we anticipate the ocean circulation slowing during the current warming, whereas it is possible that an accelerated oceanic meridional overturning circulation was a factor in driving the 1920s warming.
Surface Air Temperature Delworth+Knutson, Nature 1999 Uppernavik, West Greenland SAT anomaly (Imke Durre)
The standing-wave structure with wintertime Icelandic and Aleutian Lows gives the atmosphere some of the east-west structure and gyre circulation familiar to the ocean. The rapid radiative cooling in fall sets up a cold dome which slumps under gravity, tending to create a surface polar vortex which is anticyclonic, the convergence overhead strengthening the polar cylonic vortex…yet mountains and vertical momentum transport can intervene, opposing the surface high. In particular, the Atlantic storm-track forms a continuous connection between subtropics and the high Arctic.
Surface air temperature shows the imprint of both warmocean and the orographic component of the circulation. The ice free region of the Arctic and subArctic is marked by warmsurface air. NCEP reanal 2 Jan 1993
Standing Rossby wave models of the circulation suggest a cyclonic trough in the lee of the Rockies, which transmits wave track to the atmosphere The hemispheric baroclinity (cold air dome) provides energy for both standing and transient eddies, while ocean heating augments both (e.g., Held et al., J.Clim 2002). The surface low lies east of the 500 mb. low in this winter JFM averaged 1993 data, expressing both poleward heat flux and diabatic heating by the ocean (note particularly the Labrador Sea and subpolar Atlantic).
The atmospheric circulation is increasingly zonal with height, and variance-based maps of storm tracks are quite zonal in the upper troposphere yet the low-level tracks of storms fills out an extensive meridional ‘gyre’ centered on the Icelandic Low. (Hoskins and Hodges, JAS 2002). Storms amplify at several sites along the track, as over the warm water of the Nordic and Barents Seas. The low-pressure storm centers circulate round the Icelandic Low and spill heat and moisture onto the Eurasian continent over a broad range of latitudes.
Lagrangian storm track density – Hoskins+Hodges JAS 02based on sea-level pressure (ECMWF 1979-2000 period). NAO/AO positive index is prevalent during this period.
Storm activity propagates remarkable distances round the northern hemisphere, with one storm seeding the next, with group velocity exceeding the speed of individual storms
5-week Høvmüller plot following the principal storm tracks (Chang, Lee and Swanson J Clim 2002). This is variance of meridional velocity at 300 mb. Atlantic Pacific
Heat flux between ocean and atmosphere is inferred from many sources: atmospheric reanalysis fields (plus top-of-atmosphere radiation in the brief ERBE period), ship-board observations, aircraft boundary layer observations, satellite altimetery and thermometry, water-column heat storage, and ocean circulation. • NCEP and ECMWF net heat fluxes appear to be less accurate than re-analyzed products guided by the aircraft observations.
NCEP Aircraft (Xue et al JPO95) NCEP + Smith-deCosmo latent sensible Renfrew+Moore, 2002
Maritime storms grow ‘explosively’, and move along the Gulf Stream front and the lower atmospheric temperature front lying near the coast; In mesoscale model simulations (Kuo, Reed and Low-Nam MWR 1991) of 7 explosive storms ocean heating caused SLP deepening (13.5 mb in 48 hours of 30-40 mb total deepening) for long forecasts begun when the storms were weaker. APE generation is -favored by latent heat in the warm sector (warming warm air), -damped by sensible heat in the cold sector (warming cold-outbreak air: Orlanski et al. J.Clim.2002_
Lau’s JAS 1979 winter diabatic heating of the 700mb-1000mb lower atmosphere. Peak values are 100-150 watts/m2 in the subtropical storm track regions
This net atmospheric heating by the ocean, plus or minus radiation, is less than the surface upward flux, Qnet, inferred by most methods (as the atmosphere cools to space). The net surface heat flux peaks with winter-average values as great as 300 watts/m2 near the Gulf Stream and Labrador Sea. The Barents Sea in the Arctic is not far behind with peaks exceeding 200 watts/m2 • In the map that follows the annual-average plotted values of Qnet are less than these wintertime values, roughly by a factor of 4. This may be explained by the radiative cooling of this air mass to space, although accuracy of the observations is also unknown.
Qnet, net atmosphere-ocean heat flux, watts/m2 (Keith Tellus 95)(annual average) It should be noted that because the sun heats the ocean, O, but does not cool the atmosphere, A, the most useful maps of Qnet for A will differ those for O by the short-wave insolation.
Keith’s analysis uses top-of-the-atmosphere radiation observations from the ERBE satellite together with atmospheric reanalaysis data to infer the surface heat flux as a residual. Errors can immediately be seen in the large values over land, which cannot support significant net heat flux.
The Arctic in winter is ice-free in the Barents Sea and in regions of the Arctic rim warmed by circulation of tropical heat as part of the oceanic MOC. The relationship of ice, fresh-water and heat is an essential part of the climate system. Shrinkage of ice-cover in both winter and summer has been observed, yet there are dynamical as well as thermodynamic causes (Rigor and Wallace, 2003).
Oceanic mixed-layer depth mirrors the Atlantic storm-track (here, Levitus records the depth at which the density is greater than the surface density by an amount equivalent to 0.50 C, which is deeper than the actual depth of wintertime mixing). Deep regions of weak stratification lie beneath the storm track.
The evidence so far suggests a relationship between the heating originating in the oceanic overturning circulation, energizing the atmospheric storm track. Energy released from the polar cold-air dome through baroclinic instability is perhaps the primary source for transient eddy energy (Chang et al., J Clim 2002). Held et al. (J Clim 2002) however argue that the oceanic heat source produces significant forcing for the standing wave energy in the northern hemisphere circulation, comparable with the Himalayan plateau/Rocky Mountain orographic source. Decadal NAO variability is another issue, of course, with the oceanic high latitude heat source being less prominent (e.g. Kushnir et al. J Clim 2002). • The meridional heat transport curves, averaged zonally and in time, show this, yet with the atmosphere doing the majority of the ‘work’.
Trenberth J Climate 2001 Global meridional heat transport (based on TOA radiation, atmospheric reanalysis) ocean + atmosphere atmosphere ocean
Bryden and Imawaki, 2001, emphasize that the atmospheric contribution to meridional heat flux should be separated into sensible-heat and latent-heat components. 1 Sverdrup of water vapor (the scale amplitude of the hydrologic cycle) moving poleward carries 2.5 petawatts (2.5 x 10¹⁵ watts) of thermal energy. They plot the break-down using Keith’s 1995 data.
Global meridional heat transport: atmos (latent)(residual method, TOA radiation 85-89 atmos atmos (sensible)and ECMWF/NMC atmos obs) ocean (sensible…) Oceanic heat flux is convergent north of here Ice-cover north of here Atmospheric flux is divergent south of here data of Keith (Tellus 95) Error est.: ± 9% at mid-latitude; Bryden est 2.0 ±0.42 pW at 24N
The latent heat flux is intrinsically a coupled atmosphere-ocean mode, with the fresh-water carried north by the atmosphere returning in the ocean (Bryden et al. 2001). • A part of the poleward moisture flux switches from atmosphere to land, eventually draining in the massive outflow of Russian rivers.
Arctic river outflows (cubic km per year) Aagaard+Carmack JGR 1989 Delivery of moisture to continental interiors: sensitivity to storm-tracks, NAO/AO (e.g. Tigris-Euphrates, Cullen et al. 2001) Arctic river outflows provide ~ 4200 km3 yr-1=0.12 Sverdrup of fresh-water; P-E, Bering Strait inflow (~0.8 Sv at ~32.5 ppt) and distillation by freezing supply the rest of the exported fresh-water. (Vuglinsky 1997 ACSYS-Orcas Isl)
Traditionally, a dominant atmospheric moisture pathway takes evaporation from the subtropical Atlantic and sends it eastward across Eurasia; however with high NAO/AO index, a sizeable part of this moisture takes a more northern route, some of it entering the Arctic.
Impact of oceanic heat/fresh-water transport Despite its apparent smallness at higher latitudes, oceanic meridional heat flux is important: • Its divergence in the subtropics is the dominant source of fresh-water for the higher latitudes • Heat transport is channeled geograpically in both ocean and atmosphere, and is seasonally enhanced (sensible heat in winter exceeds that in summer by a factor of about 2.5 (Trenberth 2001), and latent heat/moisture flux is more complexly enhanced in winter (Peixoto and Oort, 1992). • Observations of ocean circulation have definitively altered the ratio of oceanic and atmospheric heat transports (see Bryden and Imawaki 2001), and we may not have heard the last word.
Seasonal cycle: how is the wintertime upward heat flux supplied? - locally stored summertime heating or - heat imported from the south by ocean circulation?
Atlantic north of 250N: air-sea heat flux calculated from reanalyzed COADS data of da Silva et al. 1994. Black: monthly heat loss Red: it’s cumulative sum starting in April Monthly flux Reaches 4.5 pW Heating of ocean (black) integrated from 1 April returns to zero by early Dec (orange) Rhines+Hakkinen 2003
In the Atlantic north of 25N, on average the previous summer’s heating is withdrawn from the ocean by early December. Subsequently, December through March, the heating of the atmosphere by the ocean is supplied almost entirely by laterally advective ocean circulation. Thus it is the geography and seasonality (concentrated arteries, steadier in the ocean, cold-season in the atmosphere) that raises the profile of oceanic heat transport to dominate in winter.
We can plot the year-day when last summer’s local heating is exhausted by fall-winter cooling. For orange areas this day falls in early December or earlier, suggesting that in these regions, for most of the winter, the oceanic warming of the atmosphere is entirely due to advection by the circulation. For blue areas it is later, often suggesting local one-dimensional closure of the heat storage with no need for advective heat-flux convergence. {In the Southern Hemisphere the year-days are shifted by 6 months so as to have the same connotation.}
by early Dec. local, seasonal heat storage is used up here In blue regions local 1-d Mixed layer heat storage dominates Year-day when seasonal heat is used up (+ 6 mo in SH)
There are several other ways to reach the same conclusion, for example mapping the ratio of seasonal cycle to annual mean heat flux divergence. Data sources range from da Silva/Levitus (1994) reanalysis of COADS, with calibration by meridional heat transport inferred from oceanic hydrography, and with constraints on net global vertical flux. • As an example, Seager et al. 2002 describe some 0.8 petawatts of heat transported northward across 35N in the Atlantic Ocean. On average this produces 37 watts/m2 of heating of the atmosphere over the ocean surface to the north. Yet the wintertime average Qnet is 135 watts/m2 substantially larger. However the fraction, say γ, of this ocean-circulation heat flux lying deeper than about 100m has to wait for winter with its deep mixed layers to escape. Its contribution to the wintertime upward heat flux is about 4 γ (taking winter to be 3 months long in this sense). Thus maps of ocean-atmosphere heat flux (as seen by the atmosphere) should compare wintertime heat flux Qnet with annual-average ocean heat-flux convergence maps multiplied by 4 γ. If γ ~ 0.5 we are comparing 2 x 37 = 74 watts/m2 from ocean circulation with 135 watts/m2 observed wintertime Qnet. In this case about 1/2 of the surface area of the northern Atlantic can be fully supplied with heat in winter by the lateral circulation, after locally stored ‘mixed-layer’ heat is removed.
Thus the conclusion is that warming and moistening of the atmosphere by the circulating ocean in middle latitudes as well as tropics is crucial to 3 scales of atmospheric motion and climate: winter storms, the stationary winter gyres of sea-level pressure (Icelandic and Aleutian Lows), and the zonally averaged poleward transport so vital to maintain equable temperatures and rainfall at higher latitude. • While this may seem obvious to many oceanographers, it has become a point of contention in the literature:
North Atlantic heat balance vs. month and latitude Carton+Wang jpo 2002ABSTRACT“Here, seasonal heat transport in the North Pacific and North Atlantic Oceans is compared using a 49-year-long analysis based on data assimilation. In midlatitudes surface heat flux is largely balanced by seasonal storage….” Surface flux Qnet (daSilva 94) Heat storage rate Ocean heat transport divergence Small but it accumulates for release in winter Contour interval 2.5 x 10⁸ w m-1
Several recent papers all argue that oceanic heat storage is ‘local’, and requires only the thin upper mixed layer to describe it. The advocates often cite Gill and Niiler (JPO 1973), who do a scale analysis based on large ocean gyres with weak mid-ocean currents (and disclaim any conclusions about more active western boundary current regions). Wang and Carton (JPO 2002), Seager, Battisti, Gordon, Naik, Clement and Cane (QJ Roy Met Soc 2002), Voison and Niiler ( JPO 1998) are among these. Seager et al. state in their abstract “Further, analysis of the ocean surface heat budget shows that the majority of the heat released during winter from the ocean to the atmosphere is accounted for by the seasonal release of heat previously absorbed and not by ocean heat-flux convergence. Therefore, the existence of the winter temperature contrast between western Europe and eastern North America does not require a dynamical ocean.“
Wintertime(DJF) average atmosphere-ocean heat flux From Seager et al. 2002 who use da Silva et al. 1994 COADS derived Qnet data Annual mean atmosphere-ocean heat flux Smaller but it accumulates
Effect of ocean heat transport convergence on GISS T42 atmosphere (Seager et al. 2002)
The geographic pattern of wintertime ocean-to-atmosphere heating by itself suggests involvement of the ocean circulation; it seems unlikely that a non-dynamical mixed-layer ocean could exhibit the large values coinciding with the northward track of the major currents. Northward heat transport by ocean circulation would be easy to identify if it were all well beneath the seasonal thermocline: simply look for deep mixed layers in winter; yet it is partitioned between deep and shallow levels. Deep mixed layers are a sufficient but not necessary symptom of dominant oceanic heat transport. Direct observations of ocean currents and hydrography complement local water-column heat storage and altimetric observations in constraining heat transport. In these studies, oceanic heat advection has been shown to be dominant in interannual variability of the heat budget in the Gulf Stream/Sargasso Sea (the ‘Bunker-Budyko Bullet’): (Dong and Kelly, JPO submitted ix2002).
Winter convective mixing has reached 110m (mild winter so far) Igor Yashayaev, BIO Canada
Bravo mooring: heat content annual cycle by layer Lilly et al. JPO 99 deep warming due by ocean heat transport
Heat content and fresh-water content of the oceanic water column, Bravo site, central Labrador Sea (1964-74 and 1990-98, Lilly et al. JPO 1999): the annual heat storage range is 2.5 to 3 GJ/m2; offsets between 1960s and 1990s reflect the NAO/AO+ period of intensely cold winters and declining ocean salinity.
Heat content in central Labrador Sea, 1997-8 (ECMWF flux integral, mooring, acoustic tomography) Fischer et al. IFM Kiel Germany Annual cycle is close to 2.5 GJ; of this, about 1 GJ is bound up In the advective, annual mean Note time of maximum heat content lagged 3 months relative to SAT and integrated air-sea heat flux and 6 months relative to insolation
The vertical structure of meridional heat transport is not unique because of the uncertain choice of reference temperature (though the heat transport divergence is unique); yet plotting the ‘temperature transport’, ρCPTv, integrated zonally across the Atlantic, is of interest. The following plot from the Hakkinen model suggests a substantial transport beneath the upper mixed layer (note the shallow southward Ekman driven transport between 35N and 50N).