Life Cycle Analysis
Life Cycle Analysis. 8803 Business and the Environment Beril Toktay College of Management Georgia Institute of Technology. What is a Product Life Cycle?. Product Life Cycle. Product disposal. Raw materials mining. Primary materials production. Component manufacture. Product

Life Cycle Analysis
E N D
Presentation Transcript
Life Cycle Analysis 8803 Business and the Environment Beril Toktay College of Management Georgia Institute of Technology
What is a Product Life Cycle? Product Life Cycle Product disposal Raw materials mining Primary materials production Component manufacture Product assembly &distribution Product use & maintenance Service Supply Chain The boxes are process groups called life cycle stages (system components). The arrows are economic material flows (relationships between system components)
Materials Energy Materials Energy Materials Energy Materials Energy Materials Energy Materials Energy Products interact with their environment in many ways Use and maintenance waste and emissions Transport and distribution waste and emissions Raw materials mining Primary materials production Component manufacture Final product assembly Product use and maintenance Product disposal Service End-of-life waste and emissions Production waste and emissions
trees logs wood chips pulp paper cup Landfill, recycling Harvesting Wood yard Digester, washing, bleaching Forming Cup use steam, chlorine (?) adhesive, heat Service oil gas oil, gas ethyl benzene styrene PS cup Landfill, recycling Drilling Refinery Catalytic dehydro- genation Poly- merization, blowing Cup use solvent, Initiator, blowing agent (pentane or CO2, used to be CFC) catalyst catalyst Service Example: Paper Cup vs. Polystyrene Cup
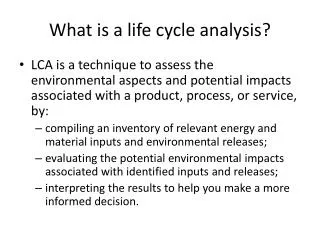
History and definition of LCA Definition of LCAaccording to ISO 14040: LCA is a technique […] compiling an inventory of relevant inputs and outputs of a product system; evaluating the potential environmental impacts associated with those inputs and outputs;and interpreting the results of the inventory and impact phases in relation to the objectives of the study. • Late 1960s, first Resource and Environmental Profile Analyses (REPAs) (e.g. in 1969 Coca Cola funds study on beverage containers) • Early 1970s, first LCAs (Sundström,1973,Sweden, Boustead,1972, UK, Basler & Hofmann,1974,Switzerland, Hunt et al.,1974 USA) • 1980s, numerous studies without common methodology with contradicting results • 1993, SETAC publishes Guidelines for Life-Cycle Assessment: A ‘Code of Practice’, (Consoli et al.) • 1997-2000, ISO publishes Standards 14040-43, defining the different LCA stages • 1998-2001, ISO publishes Standards and Technical Reports 14047-49 • 2000, UNEP and SETAC create Life Cycle Initiative
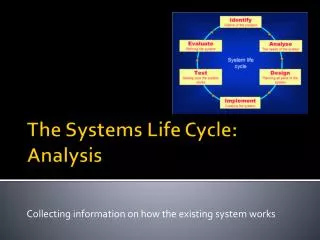
Life Cycle Assessment Framework Goal and scopedefinition (ISO 14040) Interpretation (ISO 14043) • Direct application: • product development and improvement • Strategic planning • Public policy making • Marketing • Other Inventoryanalysis (ISO 14041) Impactassessment (ISO 14042)
Step 1 - Goal and Scope Definition • It is important to establish beforehand what purpose the model is to serve, what one wishes to study, what depth and degree of accuracy are required, and what will ultimately become the decision criteria. • In addition, the system boundaries - for both time and place - should be determined. Thus, pay special attention to: • Basis for evaluation (what and why) • Temporal boundaries (time scale) • Spatial boundaries (geographic)
Goal and Scope Definition Example for Goal Definition: The goal of the LCA is to identify options for improving the environmental performance of the material polyethylene in disposable bread bags. The results of this LCA will be used for product and process development. The plastic bag manufacturer wants to be able to analyze the effects of changes in its processes, in terms of technology, inputs, and products composition, on the total environmental impact. This information, in turn, can be used to prioritize measures that can be taken to improve the environmental performance. This LCA does not aim at a public comparative assertion. The study is conducted by Pro-Duct Consultancy Ltd, a medium-sized private engineering bureau. The commissioner is Bag-Away, a large producer of plastic disposable bags. Interested parties are mainly the plastics industry, bakeries and shops. A steering committee with representatives of the producer, the ministry of the environment and academia will be formed. Finally, an expert review will be carried out at NILCAR, the National Institute for LCA Research.
Goal and Scope Definition Example for Scope Definition: A simplified LCA is carried out to compare three different end-of-life management options, namely landfill, recycling and reuse, for structural steel sections in the UK construction sector. The study and its data therefore intends to be representative of the current practices and technologies in the UK construction sector. Initially, the only environmental intervention covered will be the energy requirementsof all processes, since this has shown to be an important environmental indicator for the construction industry, and the environmental impact of main interest is climate change. The total size of the study is 8 person-months. A large portion of this time will be devoted to the studying and modeling of the product system, and the collection of representative data for the most important processes in production, use and end-of-life management.
Goal and Scope Definition Be specific about the unit of analysis! What are functional units for the comparison of Various paints? Paper versus plastic bags in supermarkets? 20m2 of wall covering with a colored surface of 98% opacity and a lifetime of 5 yrs Comfortable carrying of X kg and Y m3 of groceries
Step 2 - Inventory Analysis • This means that the inputs and outputs of all life-cycle processes have to be determined in terms of material and energy. • Start with making a process tree or a flow-chart classifying the events in a product’s life-cycle which are to be considered in the LCA, plus their interrelations. • Next, start collecting the relevant data for each event: the emissions from each process and the resources (back to raw materials) used. • Establish (correct) material and energy balance(s) for each process stage and event.
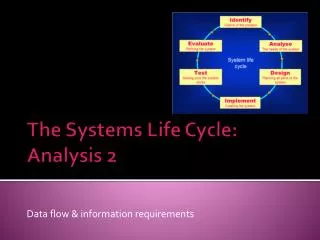
Single Stage Flow Diagram • The following diagram contains inputs and outputs to be quantified in a single stage or unit operation • see EPA Life-Cycle Design Guidance Manual, EPA Report no. EPA/600/R-92/226, page 104
Example: Simplified Process Tree for a Coffee Machine’s Life-Cycle
Example: Simplified Process Tree for a Coffee Machine’s Life-Cycle White boxes are not included in assessment/inventory
Problems with Inventory Analysis • The inventory phase usually takes a great deal of time and effort and mistakes are easily made. • Allocation is an issue. • There exists published data on impacts of different materials (http://www.nrel.gov/lci/, http://www.ecoinvent.ch/, http://www.globalspine.com/, http://lca-net.com/spold/) • However, the data is often inconsistent and not directly applicable due to different goals and scope. • It is expected that both the quantity and quality of data will improve in the future. • Results are generalized improperly.
The impact assessment focuses on characterizing the type and severity of environmental impact more specifically. Step 3 - Impact Assessment Life Cycle Inventory results ISO 14042 mandatory Classification Impact categories Characterization Category indicator results Normalization ISO 14042 optional Environmental profile Weighting One-dimensional environmental score
Impact categories SO2 emissions Acidrain Acidifiedlake Dead fish Loss ofbiodiversity Source Endpoint Midpoint CFC emissions Tropospheric OD Stratospheric OD UVBexposure Humanhealth • A category indicator, representing the amount of impact potential, can be located at any place between the LCI results and the category endpoints. There are currently two main Impact Assessment methods: • Problem oriented IA methods stop quantitative modeling before the end of the impact pathway and link LCI results to so-defined midpoint categories (or environmental problems), like acidification and ozone depletion. • Damage oriented IA methods, which model the cause-effect chain up to the endpoints or environmental damages, link LCI results to endpoint categories.
Impact categories proposed by UNEP/SETAC Life Cycle Initiative in 2003 Midpoint categories (environmental problems) Endpoint categories (environmental damages) Photochemical oxidant formation Human toxicity Human Health Ozone depletion Climate change Biotic & abiotic natural environment Acidification LCI results Eutrophication Biotic & abiotic natural resources Ecotoxicity Land use impacts Biotic & abiotic manmade resources Species & organism dispersal Abiotic resources depletion Biotic resources depletion Source: Int J of LCA 9(6) 2004
Classification and characterization - Example In general: Example: LCI results Cd, CO2, NOX, SO2, etc. (kg/functional unit) Impact category Acidification Acidifying emissions NOX, SO2, etc. (kg/functional unit) LCI results assigned to Impact category Characterization model Category indicator results Proton release (H+ aq) • Forests • Fish populations • etc. Category endpoint Source: ISO14042
Classification and characterization – Example Impact categoryAcidification LCI results Emissions of acidifying substances to the air (in kg) Characterization model RAINS10 model, developed by IIASA, describing the fate and deposition of acidifying substances, adapted to LCA Category indicator Deposition/acidification critical load Characterization factor Acidification potential (AP) for each acidifying emission to the air (in kg SO2 equivalents/kg emission) Unit of indicator result kg SO2 eq Substance AP (in kg SO2 equivalents/kg emission) ammonia 1.88 hydrogen chloride 0.88 hydrogen fluoride 1.60 hydrogen sulfide 1.88 nitric acid 0.51 Nitrogen dioxide 0.70 Nitrogen monoxide 1.07 Sulfur dioxide 1.00 Sulphuric acid 0.65 Source: (Guinée et al., 2002)
Plastic versus Paper Bag Classification • The paper bag causes more winter smog and acidification, but scores better on the other environmental effects. • The classification does not reveal which is the better bag. What is missing is the mutual weighting of the effects.
A Single Impact Figure • Goal: Develop a single figure for comparison purposes • Several methods exist, but it is still a controversial issue and no singular widely accepted method exists. • Three well-documented and used methods are: • The Eco-Points method • The Environmental Priority System • The Eco-Indicator
Eco-Points Method • The eco-points method was developed in Switzerland and is based on the use of national government policy objectives. • The evaluation principle is the distance to target principle, or the difference between the total impact in a specific area and the target value. • The target values in the original Ecopunkten method were derived from target values of the Swiss government. • There is a Dutch variant. • The use of policy objectives is controversial given that a policy does not express the true seriousness of a problem. • Various political, economic, and social considerations also play a role when formulating these objectives.
The Environmental Priority System • The EPS system was used first for Volvo in Sweden. • It is not based on governmental policy, but on estimated financial consequences of environmental problems. • It attempts to translate environmental impact into a sort of social expenditure. • The first step is to establish the damage caused to a number of “safeguard objects” - objects that a community considers valuable. • The next step is to identify how much the community is prepared to pay for these things, i.e., the social costs of the safeguard objects are established. • The resulting costs are added up to a single figure.
The Eco-Indicator (95 and 99) • The Eco-Indicator 95 was developed in a joint project carried out by companies, research institutes and the Dutch government. • Aim: develop an easy-to-use tool for product designers • Outcome: A list of 100 indicators for the most significant materials and processes. • By using these indicators a designer can easily make combinations and carry out his/her own LCA. No outside expert or software are needed. • Indicators have been drawn up for all life-cycle phases • the production of materials such as steel, aluminum, thermo-plastics, paper, glass • production processes, such as injection molding, rolling, turning, welding • transport by road, rail, and sea • energy generating processes • waste processing processes, such as incineration, dumping, recycling. • The most recent revised version is called Eco-Indicator 99.
Life Cycle Assessment Framework Goal and scopedefinition (ISO 14040) Interpretation (ISO 14043) • Direct application: • product development and improvement • Strategic planning • Public policy making • Marketing • Other Inventoryanalysis (ISO 14041) Impactassessment (ISO 14042)
Case: Disposable versus reusable diapers • Background: • P&G launched Pampers disposable diapers in the 1960s. • By the early 1990s, Pampers contributed over 18% to annual revenues. • Became symbol of the ‘throw-away’ society and was targeted by NGOs. • P&G commissioned Arthur D. Little in 1990 to conduct an LCA • The Life Cycle Analysis: • Arthur D. Little made the following simplifying assumptions among others: • The number of daily diaper changes is the same for both types of diapers. • 90% of all reusable diapers are laundered at home. • Response: • As a response to the results, Greenpeace commissioned its own LCA.
Case: Disposable versus reusable diapers Results from Study A Functional unit: Weekly diaper needs
Case: Disposable versus reusable diapers Results from Study B Functional unit: Weekly diaper needs
Case: Disposable versus reusable diapers • Which study do you attribute to each organization? • What do you think now about disposable vs. reusable diapers? • The Arthur D. Little study was only one of many LCAs that were performed to compare disposable and reusable diapers. • Their conflicting results due to different inventory data, model assumptions, boundary choices and calculation methods have prevented a generally accepted conclusion.
Case: Disposable versus reusable diapers This graph compares from two different sources, Allen et al. (1992) which report data from a Franklin Associates Study (1992) and the World Resources Institute (WRI, 1994) which reports data from the Arthur D. Little study (1990):
Case: Disposable versus reusable diapers • The data from Allen et al. is almost consistently higher than the data from the WRI, up to a factor of 6. • The ratios between disposable and reusable diaper data is consistently smaller in the Allen et al. data compared to the WRI data. • However, the general directions of the results are identical: • Reusablediapers • consume more energy and more water • Consume less raw materials • Generate more emissions to air and water • Generate less waste
The Use of LCA Who are the users? What are the uses? • LCA: • Goal & Scope • Life Cycle Inventory • Impact Assessment • Interpretation
Users of LCA • Companies: Especially in Scandinavian countries, Japan, Holland, Germany, Switzerland (e.g. Volvo, Electrolux, Honda, Toyota, Proctor & Gamble, Unilever, Corus, Arcelor, Alcan, etc.) Through in-house experts, LCA consultancies or universities. • Trade associations: Especially for material commodities (e.g. plastics, steel, aluminum, concrete, etc.) Through the experts of their member companies, LCA consultancies or universities. • NGOs: Mostly commissioned to external LCA consultancies or universities. • Government agencies: Especially in Scandinavian countries, Japan, Holland, Germany, Switzerland, EU Through in-house experts, LCA consultancies or universities. • Business analysts: Typically analyze externally created LCA information on business and sectors.
Uses of LCA • Companies: Originally intended for external use, e.g. marketing. However, currently mainly for internal use due to bad initial experiences of external uses. Currently mainly retrospective and for learning proposes, instead of prospective use for decision making purposes. Currently, decisions based on LCA results are more operational than strategic. • Trade associations: Trade associations of material commodities producers more frequently use LCA for external purposes (e.g. marketing, policy process). • NGOs: To create scientific foundations of campaigns or investigate claims by industry • Government agencies: To analyze and design environmental policies and regulations (especially by the EPAs of European countries). EUs Integrated Product Policy recommends LCA. • Business analysts: To analyze and forecast trends of individual companies and industry sectors.
Internal vs. External Use • Most companies currently use LCA for internal purposes. • Internal uses are: • Hotspot analysis of existing or planed products • Compare existing products with products under development • Product/process design (short-term, operational) • Product/process development (long-term, strategic) • As LCA methodology matures, so do the number & scope of external uses. • External uses are: • Marketing, especially final product comparisons (credibility) • Lobbying, especially commodity comparisons • Providing information and education to customers and other stakeholders • Eco-labeling (also called environmental product declarations – EPDs)
Issues with LCA • Complex and a lot of effort is required • Life Cycle Analyses have problems and are difficult to use: • What is the functional unit? • What if your process does not match the unit process in the LCA database? • Impact categorization is difficult • No national/worldwide standardized system • Without common methodology LCA results are very difficult to reproduce • Need to do LCA for every product in company
Issues with LCA • Designers and manufacturing engineers find it almost impossible to practically work with LCAs because of • the consistent lack of solid data about all aspects of a products life cycle, • the nearly infinite amount of decisions to make and data to deal with, • the lack of standardization resulting in numerous conversions and interpretations, • the lack of a standard evaluation scheme caused by and resulting in different views on what is environmentally correct, • the approach is currently only suitable for design analysis / evaluation rather than design synthesis. LCAs are "static" and only deal with a snapshot of material and energy inputs and outputs in a dynamic system.
Value of LCA • Many environmental choices are about trade-offs between different types of burdens • Without impact assessment these burdens are very difficult to compare • LCA methodology has come a long way since the early 1990s