8 STEP QUALITY CONTROL
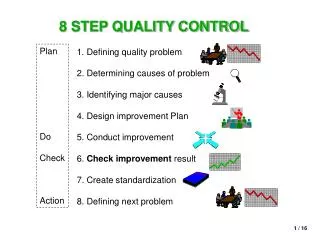
1. Defining quality problem 2. Determining causes of problem 3. Identifying major causes 4. Design improvement Plan 5. Conduct improvement 6. Check improvement result 7. Create standardization 8. Defining next problem. 8 STEP QUALITY CONTROL. Plan Do Check Action.

8 STEP QUALITY CONTROL
E N D
Presentation Transcript
1. Defining quality problem 2. Determining causes of problem 3. Identifying major causes 4. Design improvement Plan 5. Conduct improvement 6. Check improvement result 7. Create standardization 8. Defining next problem 8 STEP QUALITY CONTROL Plan Do Check Action
POSSIBLE PROBLEMS ELECTED • Behind output target • repair • Reprocess, • Reshipment, • Recheck • Machine damage • Unclear or difficult work instruction • Unqualified input or raw material • Excessive inventory • Sudden work
FLOWCHART 7 QUALITY CONTROL TOOL 7 MANAGEMENT TOOL STATISTICAL PROCESS CONTROL (SPC) VALUE ANALYSIS/VALUE ENGINEERING (VA/VE) MULTIVARIATE ANALYSIS DESIGN OF EXPERIMENT QUALITY CONTROL TECHNIQUE/TOOL
Fail Pass Sample of Flow chart Mother Board Production process Incoming Material - PCB &- Component A Fail Return to Vendor QC Pass Auto Insertion Fail QC repair Pass Manual Insertion Fail Auto Test Fail Repairman QC repair Pass Board yang by pass auto test Pass Solder & Cleaning Send Fail QC repair Pass Touch Up repair QC A
UCL LCL 7 QUALITY CONTROL TOOL 1. Checklist 2. Stratification 3. Graph and Map Control 4. Pareto Diagram 5. Cause-Effect Diagram 6. Histogram 7. Scatter diagram
Sample of Data sheet Data sheet for Defect/ product failure detect Product Name : Period : Number checked : Factory Name : Notification : Department/Section : Collector : Unit Name : SUM TYPE OF DEFECT SUB TOTAL GORESAN 32 //// //// //// //// //// //// // //// //// //// //// /// //// //// //// //// //// //// //// //// //// //// /// RETAK 23 GELEMBUNG 48 KELENGKAPAN 4 LAIN-LAIN 8 Total 115 NUMBER OF PRODUCT 86 REJECTED
Sample of Pareto Diagram Masalah MOUNT 14" Period 13-19 Des. 1996 134 100% 85% 90% 120 75% 80% 100 70% 54% 80 60% 50% 60 Frequency Percentage 40% 31% 30% 40 20% 20 10% 0 0% Lain-lain (11 items) Heater Suporter Eve/Flare Crack B/G Crack mina Heater/Alu Category
Sample of Line Chart Line Chart of IST defect 250 200 150 TEW 100 TEW1 MIB 50 0 12 15 18 21 24 28 31 1/3 1/6 1/9 January 1997
Sample of Bar Chart Menunjukkan berapa tinggi masing-masing bagian, relatif terhadap yang lain. Sumbu datar dapat berupa kategori atau waktu.
Contoh Grafik Lingkaran Explain the amount of each section compared to others
Sample of cause-effect diagram Analisa : Hasil ketik Banyak Salah - 25 Feb. 1997 Dibuat oleh : Tim A, VCR. MANUSIA LOTUS METODA KEAHLIAN BEBERAPA VERSI KONDISI FISIK WS4 SAKIT BAHASA ASING PROGRAM KOMPUTER KESUNGGUHAN PEMAHAMAN BID.KERJA SYMPHONI MENGETIK YANG MENGETIK KETELITIAN SUASANA HATI WAKTU DIKETIK ORANG LAIN KETELITIAN PEMBUAT NASKAH HASIL KETIKAN BANYAK SALAH PAGI SIANG PROGRAM TULISAN WAKTU MANUAL LISTRIK KETIK SUHU MESIN KETIK KERTAS SORE MALAM UKURAN DISKET RUANGAN MANUAL NON LISTRIK SALAH BISING SANTAI TIDAK JELAS PROGRAM KENA VIRUS MUSIK DEKORASI KONSEP SUASANA KOMPUTER INGGRIS SIBUK INDONESIA BANYAK RUSAK MESIN TEGANG PERANCIS MATERIAL LINGKUNGAN JERMAN BAHASA
Scatter Diagram • DEFINITION : • A graph to show relationship between two variable • BENEFIT: • Identify the correlation of two variables, and the significance of it • To determine the relationship found in cause-effect diagram
7 MANAGEMENT TOOLS Interrelationship Diagram 1. Affinity Diagram or KJ Method 2. 3. Tree Diagram / Systematic Diagram 4. Matrix Diagram 5. Prioritization Matrices 6. Process Decision Program Chart (PDPC) 7. . Arrow Diagram / Activity Network Diagram