Public Pensions: Ensuring Elderly Care in Modern Society
Explore the significance of public pensions in addressing the needs of the elderly, with a focus on Old Age Security Program and Canada Pension Plan. Learn about the reasons for government intervention in retirement income, including paternalism and redistribution.

Public Pensions: Ensuring Elderly Care in Modern Society
E N D
Presentation Transcript
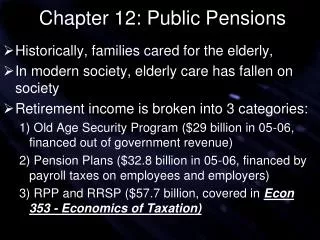
Chapter 12: Public Pensions • Historically, the elderly had their needs provided for by their families, however in modern society this has changed, and elderly care has fallen on society • Retirement income is broken into 3 categories: • Old Age Security Program ($29 billion in 05-06, financed out of government revenue) • Pension Plans ($32.8 billion in 05-06, financed by payroll taxes on employees and employers) • RPP and RRSP ($57.7 billion, covered in Economics of Taxation)
Chapter 12: Public Pensions • Why Public Pensions • Effects of Public Pensions • Old Age Security Program • Canada Pension Plan • Conclusion
Why Public Pensions The justification for publicly provided retirement income include the “usual suspects”: • Paternalism • Redistribution • Adverse selection As well as pension-specific justifications: • The Samaritan’s dilemma
Paternalism The government pay provide public retirement income due to a sense of paternalism arising from 2 sources: • People who don’t plan for the future (due to nearsightedness or high discount factors) • People who inaccurately plan for the future (not considering future costs or inflation) • One may still ask if it is right for the government to force saving for old age
Redistribution Old Age Security Program has redistributive elements because: • It is funded out of taxes, which are redistributive • Old Age Pension has a clawback • The Guaranteed Income Supplement is a NIT • This setup is preferable to welfare because: • The elderly have unique characteristics which are best met by a unique plan • Income support through a “pension” is less stigmatic than collecting welfare • Intergenerational redistribution is allowed for (if one generation is in a recession and the next is well off)
The Samaritan’s Dilemma Society wants to take care of the elderly, BUT, if a young person knows he will be taken care, of, he has an incentive NOT to save for the future. The Canada Pension Plan, RPP, and RRSP portion of Retirement Income, through required payroll contributions, forces individuals to work towards their retirement income somewhat. • Perhaps the Old Age Security Program still suffers slightly from this attitude
Unemployment in Canada Labour force participation rate – labour force as a percentage of working age population • Average 64.8% between 1976-1991 Employment rate – employment as a percentage of working age population • Average 59% between 1976-1991 Unemployment rate – unemployment as a percentage OF LABOR FORCE -Note that discouraged workers are not considered to be in the labor force
Unemployment in Canada Unemployment depends on: • People who lose their jobs and look for a new one • People who find jobs • Unemployed who drop out of labor force (discouraged workers, students, homemakers) • People who enter labour force and look for work
“TRUE” UNEMPLOYMENT? • Should discouraged workers be considered? • Are some unemployed actually looking for work? • How do we take workers who want more hours into account? (partially unemployed) • There are even difficulties in definition
Labour Market Trends • Labour participation and employment rate has increased, due to dramatic increase in participation rate of married females • These rates have fluctuated with the economy and the unemployment rate
Unemployment Trends -Canadian unemployment has increased since the 1950’s (4.2%) -This unemployment has been decreasing since 1995 -Note the US-Can gap
Provincial Unemployment -Note that duration of unemployment can be as significant than unemployment rate
Unemployment notes -in 2005, percentage of unemployed that remained unemployed for a year are: Canada: 9.6% US: 11.8% France: 42.5% Germany: 54% -Men had higher unemployment, but for a shorter time -Younger people have higher unemployment -Less education is correlated with higher unemployment
Why Employment Insurance? Two key reasons lie behind government provision of employment insurance: • Market Failure (moral hazard, adverse selection, economic cycles) • Income Redistribution
Market Failure – Adverse Selection • Some people (young males without high school) have higher unemployment and therefore higher demand for employment insurance • This results in high premiums… • Which results in unappealing insurance for low risk individuals… • Which raises premiums even higher Government insurance avoids adverse selection by offering premiums based on AVERAGE expected loss to EVERYONE
Market Failure – Moral Hazard • Employers can fire their workers, deciding whether they use employment insurance • Unemployed can lengthen their unemployment time, affecting the amount of EI they receive Government insurance can’t eliminate Moral Hazard, but it limits it through: • Offering no EI for the first few weeks of unemployment • Only paying a portion of employed earnings • Similar to a deductible in typical insurance
Market Failure – Econ. Cycles • During a recession, employment insurance claims rise • During an expansion, employment insurance claims fall • The government is better equipped to borrow and save to weather these movement
EI and Income Redistribution • EI naturally redistributes wealth from those who don’t suffer employment loss to those who do • Since some people have claims more often and longer claims, there is even more redistribution • IS Employment Insurance good as an income redistribution program? • There are those who agree…(next slide) • There are those who disagree…(2 slides hence)
EI and Income Redistribution YES • Employment Insurance supplements social assistance • People receiving EI may not need welfare programs • Some argue that Employment Insurance has less of a work disincentive than typical welfare • There is no implicit tax rate on earnings • EI requires a certain level of work, and therefore is similar to “workfare” (Osberg, 1995) • EI helps those who normally have employment while social assistance helps those who have limited ability to be self-supporting
EI and Income Redistribution NO • Employment Insurance does a poor job of redistributing income to the poor • People in equal positions are not treated equally (horizontal equity) • Tax burdens are not distributed fairly across people with different abilities to pay (vertical equity) • Employment Insurance causes major labour market distortions (firms and workers)
EI History – 1930’s • 1933 – 25% unemployment, 15% “on relief” • “On relief” largely covered by provincial and municipal governments • 1935 social insurance program ruled ultra vires; outside the federal government’s jurisdiction • 1867 Constitution Act amended (by federal and provincial governments) to allow for federal unemployment insurance
EI History –1940’s and 1950’s • 1940 Unemployment Insurance Act • Covered jobs with MODERATE risk of unemployment (not high or low risk) • 42% of labour force • 50% of wage benefits, plus 15% if married • lasting for 1/5 of days worked in last 5 years, minus 1/3 of days already claimed in last 3 years • 1950’s – UI extended to seasonal workers and “self-employed” fishermen
EI History –1971 Reforms • 1971 Unemployment Insurance Act (Bill C-229) • Covered 93% of labor force (including self-employed) • Minimum eligibility – 8 weeks of work • Benefit 66% of wage, 75% with dependents • Had a maximum insurable earnings level • Sickness and maternity benefits increased • Duration linked to weeks worked in qualifying period • Increased when national unemployment exeeded 4% • Increased when regional unemployment exceeded national by 1-3% (regional extended benefits)
EI History –1971 Reform Impact • Unemployment was constant between 1971 and 1972, yet: • People covered: 5.4 million to 7.8 million • Weeks of benefits: 22.6 million to 30.5 million • Average weekly payment: $40.28 to $61.79 • Expenditure more than tripled: • $0.59 billion to $1.87 billion • Expenditure rose from 0.8% of GNP in 1971 to 2.1% in 1975
EI History –1975 Reforms • Those who quit or were fired from misconduct couldn’t claim for 6 weeks (up from 3) • Age limit reduced to 65 years (from 70) • 75% dependent coverage eliminated (all 66%) • Increased benefits became linked to an 8 year moving average, instead of 4% trigger
EI History –1977 Reforms • New entrants, re-entrants to labor force and people with repeated claims needed more weeks of employment to qualify • Exemptions for repeat claimants in high-unemployment regions • Benefits reduced to 60% of wage (from 66%) • High income earners clawed back at 30% in net income was 1.5 times maximum insurable earnings
EI History –1980’s • Unemployment went from 7.6% (1981) to 11.9% (1983) • Benefits rose from $4.76 billion to $10.1 billion • Macdonald Royal Commission on the Economic Union and Development Prospects for Canada (1985) concluded: • UI increased unemployment rates since 1971 • Income redistribution should be replaced by a NIT The commission was opposed by Altantic Canada and labor movement and was never adopted
EI History –1980’s • 1989 Bill C-21 did some changes: • UI funds could be used for training, relocation assistance, and other employment measures • This was meant to fight long-term unemployment • Repeat users no longer had different qualification provisions • UI became entirely funded by employer and employee contributions (no general fund government funding) (as of 1991-1992)
EI History –1990’s • Unemployment rose to 11.3%, causing an UI deficit • Government increased employee and employer contributions • This may have lead to more lay-offs • 1993 benefits reduced to 57% (from 60%) • Those who quit without just cause became ineligible for UI benefits
EI History –1990’s • 1994 – UI eligibility in high unemployment regions increased to 12 weeks (from 10) • 20 weeks was required in other regions • Benefits could last from 17 to 50 weeks depending on weeks worked and regional unemployment • Benefit reduced to 55% (from 57%) • But raised to 60% for low-income recipients with dependents • Employee contributions increased again
EI History –1996 Reforms • 1996 Employment Insurance Act eligibility: • Eligibility based on HOURS of last 52 weeks • 420-700, depending on unemployment rate • 910 hours for new entrants to labor force and those entering after 2 years • 600 hours for sickness, maternity, or parental benefits • Fishing benefits depend on earnings in a fishing season ($2500 to $4200 depending on regional unemployment) • This change took part time work and seasonal work into account much better
EI History –1996 Reforms Benefits • 55% of insurable earnings, to a maximum of $39,000 (reduced from $42,380) • This has held constant, allowing a maximum $413 payment per week • Low-income claimants with children can get a Family Supplement to increase their benefits to 80% (family income less than $25,921) • Incomes exceeding $48,750 repay 30% of benefits • 2 week waiting period • Coverage time depends on hours of work and regional unemployment rate • Week limits for maternity, sickness, and paternal
Labour Market Effects of EI • Moral Hazard problems exist if: • An insured individual can affect the probability and magnitude of a loss and • This changing behaviour is unobservable • Moral Hazard doesn’t focus on those who abuse and cheat the system • Moral Hazard can apply to both employers and employees
Labour Market Effects of EI • Some studies (Grubel et al. 1975) found that an increase in EI generosity increased the unemployment rate • But other studies (Corak 1994) found no aggregate effect (but he allowed for non-aggregate effects) • Other factors affect the unemployment rate aside from EI
Labour Market Effects of EI • The labour market effects of the Canadian Employment Insurance System can be divied into: • Direct Effects (layoffs, quits, duration of employment, labour force participation) • Systemic Effects (industrial mix, labour mobility, education) • Macroeconomic Effects (automatic stabilizing effects)
Direct Effects • Unemployment is caused by: • Seasonal variations in demand • Business cycle fluctuations in demand • Long term trends in the economy EI is aimed at the second cause. • Seasonal layoffs are predictable and therefore not an insurance risk • Trends require retraining or moving, not temporary income replacement
Direct Effects - Layoffs • From 1980 to 1988, • 58% of lost jobs were permanent layoffs • 21% temporary layoffs • 21% quitting (Baker et al, 1996) • When a firm needs to cut costs, including labour, it can reduce hours or lay off • With EI, laying (which has EI support) off is more attractive than reducing hours (which has no EI support) • Therefore EI encourages layoffs • Some firms (incl. gov.) may design job length according to minimum EI work requirements
Direct Effects - Quits • Prior to 1993, workers who quit got UI in Canada but not the states, resulting in: • Equal job quitting in Canada and the US • 20.6 weeks average unemployment in Canada • 11.2 weeks average unemployment in US • (Baker et al, 1996) • If EI applies to quitters, the unemployment rate is increased by longer job searches
Direct Effects – Unemployment Duration • Better EI benefits can lengthen the time people spend looking for “the perfect job” • This increases the unemployment rate BUT • This extra time spent searching can lead to a better fit • This leads to better labour market performance • This leads to lower job turnover • This decreases the unemployment rate
Direct Effects – Labor Force Participation • All workers pay the same EI premiums, but marginal workers who are often unemployed benefit more • Therefore marginal workers are encouraged to join the labour force by better EI benefits • If the number of jobs is constant, this increases unemployment • Sharis and Kuch (1978) found EI increased the labor force, especially among married females
Systemic Effects– Industrial Mix • EI Premiums vary with wage • This relationship doesn’t vary among industries • Premiums are NOT based on expected EI benefits or layoff likelihood • This does vary among industries • This causes seasonal jobs and small firms to gain more benefits that they pay in • EI therefore subsidizes seasonal and volatile work by taxing stable employment • (See table in future slide)
Benefit-Tax Ratios 2004 • High=More Benefits than Premiums
Systemic Effects– Labor Mobility • EI provides greater support to industries and provinces with higher unemployment rates • EI gives Unemployed workers the support to move to a lower-unemployment area and find a job, increasing labor mobility • BUT • EI also DECREASES the income gain from moving, decreasing labor mobility • Studies are inconclusive, plus 70% of people change provinces for non-work reasons
Benefit-Tax Ratios 2004 • High=More Benefits than Premiums
Systemic Effects– Education • If EI is generous, there is a greater opportunity cost to stay in school instead of entering the workforce (especially in seasonal industries) • In the 1970’s many young people in rural Atlantic Canada chose a “pogey”/Employment Insurance lifestyle over education • Yet in 1991, a greater percentage of young people in Atlantic Canada attended university than the national average.
Macroeconomic Effects –Automatic Stabilization Effects • If EI benefits paid out increase and total premiums decrease in a recession AND • EI premium incomes increase and benefits paid out decrease during a boom THEN • EI acts as an automatic economy stabilizer • This does seem to occur in the recessions of the early 1980’s and the early 1990’s and the boom of the later 1980’s BUT • EI structure has changed over time (especially increasing premiums and disallowing long-term deficits), reducing this effect