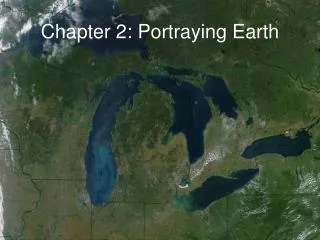
Chapter 2 Portraying Earth
Chapter 2 Portraying Earth. Physical Geography A Landscape Appreciation, 9/e Animation Edition. Victoria O. Alapo, Instructor Geog 1150. Portraying Earth. The Nature of Maps Map Projections Isolines Global Positioning System Remote Sensing Geographic Information Systems.

Chapter 2 Portraying Earth
E N D
Presentation Transcript
Chapter 2 Portraying Earth Physical Geography A Landscape Appreciation, 9/e Animation Edition Victoria O. Alapo, Instructor Geog 1150
Portraying Earth • The Nature of Maps • Map Projections • Isolines • Global Positioning System • Remote Sensing • Geographic Information Systems
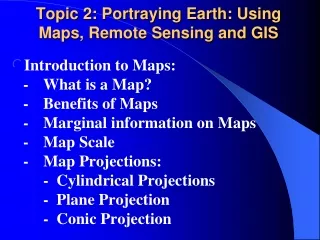
The Nature of Maps • A map is a 2 dimensional representation of earth; i.e. of spatial distribution of selected phenomenon. They are scaleddrawings of a portion of the landscape. • Maps can also be 3 dimensional, if they’re globes. • See pg 31 for “Map Essentials” – things a good map MUST have. Sometimes these essentials occur in combination e.g. “U.S. Population, Census 2000”. Also, see Africa map (pg 33).
Globes vs. Maps • Advantages & Disadvantages: • Globes – - They are correct representations - They are cumbersome - You can only see one half at a time • Flat Maps – - The whole world can be viewed all at one time - Easy to carry and manage into publications - They offer even at best, only distorted views of the Earth
Map Scale • A scale is the relationship between the length measured on a piece of paper (map) and the corresponding distance on the ground. In other words, how much of the earth is being shown on a piece of paper. • Types of Scale (see next slide, and pg 31) • Graphic Scale • Verbal Scale • Representative Fraction or Ratio Scales • Large and Small Scales: • A large scale map has a small denominator and shows more detail e.g. an architect’s blueprint • A small scale map is the opposite e.g. a globe • Which is small and large scale on next slide?
Map Projections • A system whereby the rounded surface of Earth is transferred onto a flat piece of paper. “Orange peel”. • No projection is perfect, but some are better than others. Main types: • Interrupted (Goode’s) • Cylindrical / Mercator – many old school maps • Robinson – compromise btw the first 2; found a lot in textbook (and National Geographic). See pg 36, and inside covers • Conic • Plane
Conformality (shape) vs. Equivalence (size) A cartographer has to decide if shape or size has to be sacrificed. You can’t have both. It’s impossible.
Isolines • From Greek, “Isos”, meaning, “equal”. It is any line that joins points of equal value of something e.g., Elevation/contour lines. • See pg 41. Contours always have intervals btw them. And the “closer” the lines, the “steeper” the slope, and vice-versa. Also, see Zorinsky Lake. • See pg 39 for other examples of Isolines.
IsolinesAverage Annual Precipitation See pg 40 (Figure 2-16a)
Global Positioning System (GPS) • Satellite-based system originally developed by the military for guiding missiles, etc. Now used for civilian purposes as well. • It uses longitudes and latitudes to determine positions. • Pilots use it for navigation, so does On*Star, car & phone GPSes. Pg 42, Fig -18
Remote Sensing • Any measurement or acquisition of information about the Earth by a recording device that is NOT in physical contact with it. • The earliest ones were taken by balloons (France, 1858; U.S., 1860) • Later airplanes Various types: • Aerial Photographs • Orthophoto Maps • Color and Color-Infrared Sensing • Thermal Infrared Sensing • Microwave, Radar, and Sonar Sensing • Multispectral Remote Sensing
Aerial Photographs • These can be vertical or oblique. See next slide and pg 43. • They usually overlap • They used to be black & white, but now come in color • Of great importance to City Planning Offices
Orthophoto Maps • These are multi-color distortion-free photographic image maps. • In other words, they’re prepared from aerial photos, and a lot of the distortions have been removed.
This is color Infra-red sensing (from Landsat). Thermal infra-red uses “heat” to find things. Reddest areas are most recent cuts
Sonar & Radar Sensing See textbook for meaning of acronyms. “Sonar” uses sound. Microwave technology was developed by the military; by mistake actually.
Geographic Information Systems (GIS) Using computers to map and analyze data.