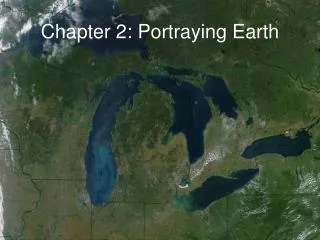
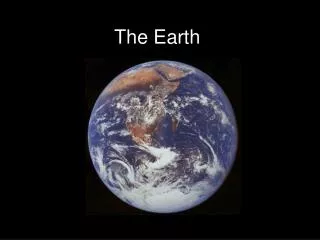
Portraying the Earth
Portraying the Earth. Chapter 2. The Nature of Maps. How and why do we describe the earth using maps? When we need to understand the world around us we use maps.

Portraying the Earth
E N D
Presentation Transcript
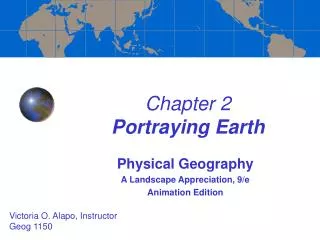
Portraying the Earth Chapter 2
The Nature of Maps • How and why do we describe the earth using maps? • When we need to understand the world around us we use maps. • A map is a two or three-dimensional representation of the Earth and a spatial distribution of selected phenomena– normally the components of a landscape. • The basic attributes of a map • Show direction, distance, size, and shape • Spatial relationships of features of the earth • Maps have a special purpose
Map Scale • The scale of a map gives the relationship between length measured on the map and corresponding actual distance on the ground. • Scale types • Graphic Map Scale uses a line marked off in graduated distances. • Fractional Map Scale compares map distance with ground distance in a proportional fraction or ratio called a representative fraction. • Verbal Map Scale or word scale, state in words the ratio of the map scale length to the actual distance on the Earth’s surface.
Large Scale and Small Scale • Large Scale Maps. • Large representative fraction, or the denominator is small. 1:10,000 • See more detail in the map • Portrays a smaller area of the earth • Small Scale Maps • Small representative fraction, or the denominator is large, 1:1,000,000 • See less detailin the map • Portrays a large areaof the earth
Map Essentials - Components of a Map • Title: short brief summary of map’s contents • Date: should be the date of the compilation of the data found on the map. • Can also be the date of the data found on the map • Legend: information about the symbols colors, and such used to depict the features of the map • Scale: if map is more than a pictogram. Scale can be either graphic, verbal, for fractional.
Components of a Map ht://www.eventrite.com/event/7649380503?utm_source=Members&utm_campaign=39381712db-2011_11_09_Meeting_Announcement10_18_2011&utm_medium=email&utm_term=0_cf57194600-39381712db-283093897
Map Essentials Direction: a north arrow (top of the map, should be north). If there is a grid, there should still be a north arrow. Location: grid, such as latitude and longitude, to be used to locate features Data Source: source of the data found on the map Projection type: in what projection is the data on the map
Globes Best substitute for depicting the earth The only thing changed in depicting the earth onto a globe is the size Shows comparative distances, sizes, and accurate directions. Represents without distortion, the spatial relationships of features of the earth Problem, because the globe will be set a very small scale (detail is lost)
Map Projections • A system whereby the spherical surface of the earth is transformed to display on a flat surface. • Three basic projection styles for the earth • Cylinder • Cone • Flat • Using a globe inside the Earth with each style, the lines or features are transferred to the paper
Equivalence Projection – equal area projection The size ratio of any area on the map to the corresponding area on the ground is the same all over the map Desirable because misleading impressions are avoided. Difficulty to achieve on small-scale maps, to maintain proper areal relationships Equivalence versus Conformaty
Equivalence versus Conformaty • Conformal Projection – conformal relations • Proper angular relationships are maintained so that the shape of something on the map is the same as its shape on the Earth • Meridians and Parallels cross each other at right angles. • Most notable projection is probably the Mercator projection. • A Robinson projection is a compromise between a equivalence and conformality.
Projections • Mercator, the most famous Projection • Developed in 1569 by Flemish geography and cartographer, Gerhardus Mercator. • Developed for use in navigation of ships • Advantage: showsLoxodromesor Rhumb lines as straight lines. • Problem with the Mercator, • Extreme East-West distortion in higher latitudes • To compensate Mercator stretched the spacing north and south to compensate. • Allowed shapes to be reasonably accurate but proper size relationships distorted.
Projections • The Plane projection – azimuthal or zenithal projection. • Obtained by projecting markings of the globe on a flat piece of paper that is tangent to one point of the globe • Used often in large scale maps or small areas of the globes • Usually is shown from either the North Pole or the South Pole
Projections • The Conic Projection • Obtained by projecting the markings of the globe onto a cone wrapped tangent to or intersecting a portion of the globe • Normally the apex of the cone is positioned about a pole which means the circle of tangency coincides with a parallel. • Best suited for regions of east-west orientation in the mid latitudes.
Funky Projections • Pseudocylindrical projection – elliptical or oval projection • Football shape of usually the whole world • Interrupted projections • Most famous – Goode’s interrupted homolosine projection
Computer Cartography • Using computers to create maps • Symap (first software used to make maps • 1965 • Global Positioning Systems • Remote Sensing • Imagery • Multi-spectral Remote Sensing • Geographic Information Systems • Widely used today • Expanding industry
Isolines • Portray the spatial distribution of some phenomenon on the earth. • Isarithm, isogram, isopleth, and isometric lines are synonymous for our purposes • Most important to physical geography • Elevation Contour Line – depicts elevation • Isotherm – depicts equal temperature • Isobar – depicts equal atmospheric pressure • Isohyet – depicts equal quantities of precipitation • Isogonic Line – depicts equal magnetic declination
Characteristics of Isolines Always closed lines- is line comes to the end of a map the line probably proceeds to the next area Represent gradations in quantity, never touch or cross one another Numerical difference between one isoline and another is an interval. Isolines close together indicate a steep gradient, those far apart indicate a gentle gradient.
Global Positioning System (GPS) A satellite based system for determining accurate positions on or near the Earth’s surface. Developed in the 1970’s for the military Based on 24 high-altitude satellites configured so that a minimum of 4 satellites are in view of any position on the Earth. Each satellite continuously transmits both identification and positioning information that can be picked up by receivers on Earth. Position determined through triangulation.
Remote Sensing • Any measurement or acquisition of information by a recording devise that is not in physical contact with the object under study-in this case the Earth. • Satellite remote sensing • Imagery obtained from geosynchronous orbit satellites. • Aerial Photographs • Photographs taken from an elevated platform, such as a balloon, airplane or rocket. • Photographs classified either oblique or vertical.
Imagery • Orthophoto Maps – multicolored, distortion-free photographic image maps. • All displacement caused by camera tilt or differences is removed. • Shows greater detail than a conventional map but retains the characteristic of a map • Color or Near Infrared Imagery • Refers to the visible-light region of the electromagnetic spectrum • Near Infrared Color is used to depict vegetation • Thermal Infrared Sensing – depicts temperature
Multi-spectral Remote Sensing • Multi-spectral or Multi-band – different regions of the electromagnetic spectrum • Landsat imagery • Launched in the 1970’s and 1980’s • Four spectral bands • Earth Observing System (EOS) • Moderate Resolution Imagery Spectroradiometer (MODIS) • 36 spectral bands • Radar and Sonar Sensing
Geographic Information Systems (GIS) • Automated system for the capture, storage, retrieval, analysis, and display of spatial data. • A GIS can manipulate rows and columns of tabular and links it to the spatial features it represents. • All the features depicted in the GIS have a coordinate system that ties them to a coordinate system of the earth • Knows where it is on the earth’s surface • Allows for the many layers of different features to be over-laid to form maps that can be used to make decisions.