Download
1 / 23
230 likes | 343 Vues
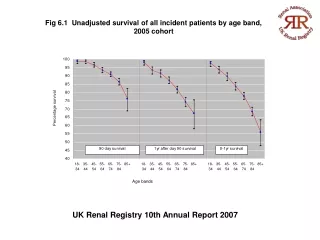
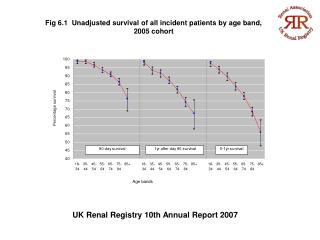
Fig 6.1 Unadjusted survival of all incident patients by age band, 2005 cohort. UK Renal Registry 10th Annual Report 2007. Fig 6.2 One year after 90 days death rate per 1000 patients years by nation and age group for incident patients, 2002-2005 cohort.

E N D
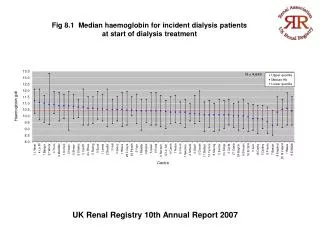
Fig 6.1 Unadjusted survival of all incident patients by age band, 2005 cohort UK Renal Registry 10th Annual Report 2007
Fig 6.2 One year after 90 days death rate per 1000 patients years by nation and age group for incident patients, 2002-2005 cohort UK Renal Registry 10th Annual Report 2007
Fig 6.3a Kaplan-Meier 9-year survival of incident patients 1997-2005 combined cohort (from day0) UK Renal Registry 10th Annual Report 2007
Fig 6.3b Kaplan-Meier 9-year survival of incident patients 1997-2005 combined cohort (from day0) with transplant censored UK Renal Registry 10th Annual Report 2007
Fig 6.4 1st-year monthly hazard of death, by age band, 1997-2005 cohort UK Renal Registry 10th Annual Report 2007
Fig 6.5 One-year death rate per 1000 patients years for all age groups UK Renal Registry 10th Annual Report 2007
Fig 6.6 Change in KM long term survival by year of start (vintage); patients aged 18 - 64 years UK Renal Registry 10th Annual Report 2007
Fig 6.7 Change in KM long term survival by year of start (vintage); patients aged +65 years UK Renal Registry 10th Annual Report 2007
Fig 6.8 Six monthly hazard of death, by vintage and age band, 1997-2005 incident cohort after day 90 UK Renal Registry 10th Annual Report 2007
Fig 6.9 Six monthly hazard of death, by vintage and age band, 1997-2005 non-diabetic incident cohort after day 90 UK Renal Registry 10th Annual Report 2007
Fig 6.10 Six monthly hazard of death, by vintage and age band, 1997-2005 non-diabetic incident cohort after day 90 UK Renal Registry 10th Annual Report 2007
Fig 6.11 Change in one-year after 90 day adjusted (age 60) survival, 1999-2005 Showing 95% confidence intervals UK Renal Registry 10th Annual Report 2007
Fig 6.12 Survival one year after 90 days, adjusted to age=60, 2005 cohort UK Renal Registry 10th Annual Report 2007
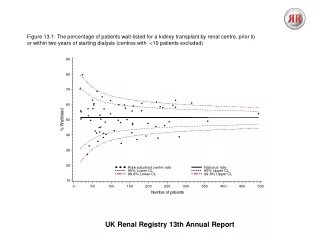
Fig 6.13 Funnel plot of age adjusted 1 year after 90 days survival, 2002-2005 cohort UK Renal Registry 10th Annual Report 2007
Fig 6.14a Change in 1 year after 90 days survival after adjustment for age, diagnosis and co-morbidity, cohort 2001-2005 UK Renal Registry 10th Annual Report 2007
Fig 6.14b Change in 1 year after 90 days survival after adjustment for age, diagnosis and co-morbidity, cohort 2001-2005 UK Renal Registry 10th Annual Report 2007
Fig 6.15 One year survival of prevalent dialysis patients in different age groups on 1/1/2006 UK Renal Registry 10th Annual Report 2007
Fig 6.16 One year survival of prevalent dialysis patients aged under 65 on 1/1/2006 per centre UK Renal Registry 10th Annual Report 2007
Fig 6.17 One year survival of prevalent dialysis patients aged 65 and over on 1/1/2006 per centre UK Renal Registry 10th Annual Report 2007
Fig 6.18 One year survival of prevalent dialysis patients on 1/1/2006 per centre adjusted to age 60 UK Renal Registry 10th Annual Report 2007
Fig 6.19 Funnel plot of 1 year survival of prevalent dialysis patients aged adjusted to age 60 on 1/1/2006 UK Renal Registry 10th Annual Report 2007
Fig 6.20 Death rate per 1000 patients years by nation and age group for prevalent dialysis patients UK Renal Registry 10th Annual Report 2007
Fig 6.21 Serial one year survival for prevalent dialysis patients in the UK UK Renal Registry 10th Annual Report 2007