Download
1 / 11
110 likes | 126 Vues
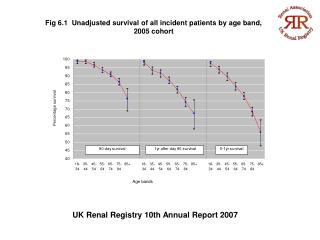
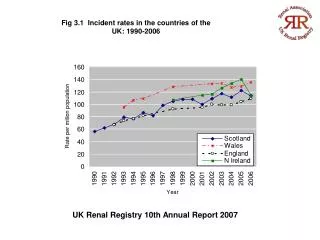
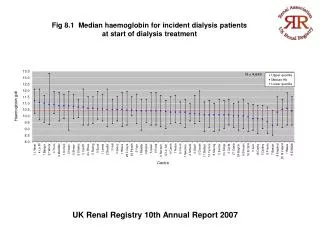
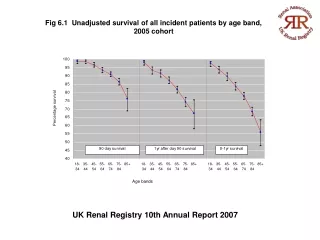
This report presents prevalence rates, growth trends, and demographic profiles of renal patients in the UK based on the 2007 UK Renal Registry Annual Report data. Figures detail prevalence rates and treatment modalities from 1982-2006.

E N D
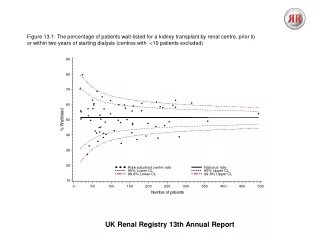
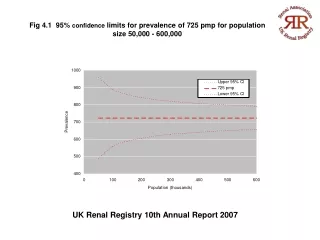
Fig 4.1 95% confidence limits for prevalence of 725 pmp for population size 50,000 - 600,000 UK Renal Registry 10th Annual Report 2007
Fig 4.2 95% confidence limits for prevalence of 725 pmp for population size 50,000 – 4 million UK Renal Registry 10th Annual Report 2007
Fig 4.3 Growth in prevalent patients, by treatment modality at the end of each year, 1982-2006 UK Renal Registry 10th Annual Report 2007
Fig 4.4 Percentage non-Whites in areas with significantly low, normal and significantly high SPR values (median and quartiles) on 31/12/2006 UK Renal Registry 10th Annual Report 2007
Fig 4.5 Ethnicity and standardised prevalence ratio for all covered local authorities on 31/12/2006 UK Renal Registry 10th Annual Report 2007
Fig 4.6 Age distribution (1 year age bands) of prevalent RRT patients split by treatment modality (dialysis or transplant) on 31/12/2006 UK Renal Registry 10th Annual Report 2007
Fig 4.7 Age profile of prevalent RRT patients by gender on 31/12/2006 UK Renal Registry 10th Annual Report 2007
Fig 4.8 Crude Rate per Million Population by Age and Gender for the UK stock on 31/12/2006 UK Renal Registry 10th Annual Report 2007
Fig 4.9 Treatment modality in prevalent RRT patients on 31/12/2006 UK Renal Registry 10th Annual Report 2007
Fig 4.10 Treatment modality distribution by age in prevalent RRT patients on 31/12/2006 UK Renal Registry 10th Annual Report 2007
Fig 4.11 Proportion of prevalent dialysis patients on HD by age group on 31/12/2006 UK Renal Registry 10th Annual Report 2007