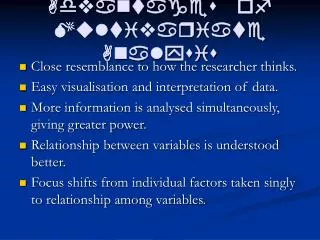
Analysis and Interpretation: Multiple Variables Simultaneously
Analysis and Interpretation: Multiple Variables Simultaneously. Chapter 13. Univariate v. Multivariate. Cross-Tabulation. Shows relationships between two or more variables Pearson chi-square test Nominal level. Cross-Tabulation. Independent Samples T-Test for Means.

Analysis and Interpretation: Multiple Variables Simultaneously
E N D
Presentation Transcript
Analysis and Interpretation: Multiple Variables Simultaneously Chapter 13
Cross-Tabulation • Shows relationships between two or more variables • Pearson chi-square test • Nominal level
Independent Samples T-Test for Means • Determine whether two groups differ on some characteristic • Examples: Genders, Yes/No
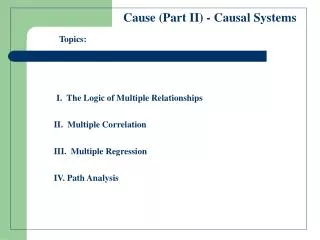
Pearson Correlation Coefficient • Degree of association between continuous variables • -1------------------0------------------1 • Does NOT mean causation
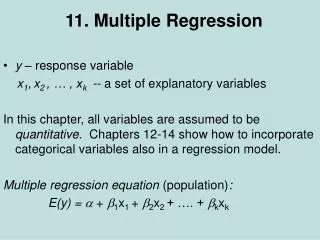
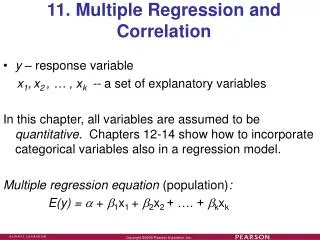
Regression Analysis • Relationship between one or more predictor variable and an outcome variable • Coefficient of multiple determination • R2