Hierarchical Clustering: Methods, Distance Measures, and Applications
370 likes | 850 Vues
Explore hierarchical clustering methods, how clusters are merged/split, different distance measures, and their effects on clustering results. Learn about AGNES, UPGMA, TreeView, and DIANA for comprehensive insights.

Hierarchical Clustering: Methods, Distance Measures, and Applications
E N D
Presentation Transcript
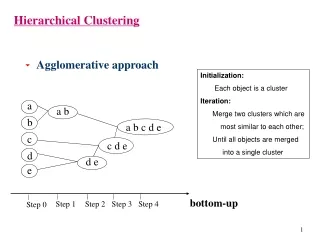
bottom-up Step 1 Step 2 Step 3 Step 4 Step 0 Hierarchical Clustering • Agglomerative approach Initialization: Each object is a cluster Iteration: Merge two clusters which are most similar to each other; Until all objects are merged into a single cluster a a b b a b c d e c c d e d d e e
Hierarchical Clustering • Divisive Approaches Initialization: All objects stay in one cluster Iteration: Select a cluster and split it into two sub clusters Until each leaf cluster contains only one object a a b b a b c d e c c d e d d e e Top-down Step 3 Step 2 Step 1 Step 0 Step 4
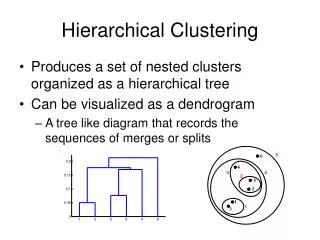
Dendrogram • A binary tree that shows how clusters are merged/split hierarchically • Each node on the tree is a cluster; each leaf node is a singleton cluster
Dendrogram • A clustering of the data objects is obtained by cutting the dendrogram at the desired level, then each connected component forms a cluster
Dendrogram • A clustering of the data objects is obtained by cutting the dendrogram at the desired level, then each connected component forms a cluster
Distance? How to Merge Clusters? • How to measure the distance between clusters? • Single-link • Complete-link • Average-link • Centroid distance Hint:Distance between clusters is usually defined on the basis of distance between objects.
How to Define Inter-Cluster Distance • Single-link • Complete-link • Average-link • Centroid distance The distance between two clusters is represented by the distance of the closest pair of data objects belonging to different clusters.
How to Define Inter-Cluster Distance • Single-link • Complete-link • Average-link • Centroid distance The distance between two clusters is represented by the distance of the farthest pair of data objects belonging to different clusters.
How to Define Inter-Cluster Distance • Single-link • Complete-link • Average-link • Centroid distance The distance between two clusters is represented by the average distance of all pairs of data objects belonging to different clusters.
How to Define Inter-Cluster Distance mi,mj are the means of Ci, Cj, • Single-link • Complete-link • Average-link • Centroid distance The distance between two clusters is represented by the distance between the means of the cluters.
An Example of the Agglomerative Hierarchical Clustering Algorithm • For the following data set, we will get different clustering results with the single-link and complete-link algorithms. 5 1 3 4 2 6
Result of the Single-Link algorithm 5 1 3 4 2 6 3 1 4 5 2 6 Result of the Complete-Link algorithm 5 1 3 4 2 6 3 1 2 4 5 6
5 1 5 5 4 1 3 1 4 1 2 2 5 2 5 5 2 1 5 2 5 2 2 2 3 3 6 6 3 6 3 1 6 3 3 1 4 4 4 1 3 4 4 4 Hierarchical Clustering: Comparison Single-link Complete-link Average-link Centroid distance
1 2 5 3 6 4 1 2 5 3 6 4 1 2 5 3 6 4 Compare Dendrograms Single-link Complete-link Centroid distance Average-link 2 5 3 6 4 1
Effect of Bias towards Spherical Clusters Single-link (2 clusters) Complete-link (2 clusters)
Two Clusters Strength of Single-link Original Points • Can handle non-global shapes
Limitations of Single-Link Original Points Two Clusters • Sensitive to noise and outliers
Two Clusters Strength of Complete-link Original Points • Less susceptible to noise and outliers
Which Distance Measure is Better? • Each method has both advantages and disadvantages; application-dependent, single-link and complete-link are the most common methods • Single-link • Can find irregular-shaped clusters • Sensitive to outliers, suffers the so-called chaining effects • Complete-link, Average-link, and Centroid distance • Robust to outliers • Tend to break large clusters • Prefer spherical clusters
Limitation of Complete-Link, Average-Link, and Centroid Distance The complete-link, average-link, or centroid distance method tend to break the large cluster.
AGNES (Agglomerative Nesting) • Introduced in Kaufmann and Rousseeuw (1990) • Implemented in statistical analysis packages; e.g., S+ • Use single-link method • Merge nodes that have the least dissimilarity • Eventually all objects belong to the same cluster
1 å å = d ( C , C ) d ( p , q ) avg i j n n Î Î p C q C i j i j UPGMA • UPGMA: Unweighted Pair-Group Method Average. • Merge Strategy: • Average-link approach; • The distance between two clusters is measured by the average distance between two objects belonging to different clusters. Average distance ni,nj: the number of objects in cluster Ci, Cj.
TreeView • UPGMA • Order the objects • The color intensity represents expression level. • A large patch of similar color indicates a cluster. Eisen MB et al. Cluster Analysis and Display of Genome-Wide Expression Patterns. Proc Natl Acad Sci U S A 95, 14863-8. http://rana.lbl.gov/EisenSoftware.htm http://genome-www.stanford.edu/serum/fig2cluster.html
DIANA (Divisive Analysis) • Introduced in Kaufmann and Rousseeuw (1990) • Implemented in statistical analysis packages, e.g., S+ • Inverse order of AGNES • Eventually each node forms a cluster on its own
DIANA- Explored • First, all of the objects form one cluster. • The cluster is split according to some principle, such as the minimum Euclidean distance between the closest neighboring objects in the cluster. • The cluster splitting process repeats until, eventually, each new cluster contains a single object or a termination condition is met.
C C2 C1 Splitting Process of DIANA Intialization: • Choose the object Oh which is most dissimilar to other objects in C. 2. Let C1={Oh}, C2=C-C1.
Splitting Process of DIANA (Cont’d) Iteration: 3. For each object Oi in C2, tell whether it is more close to C1 or to other objects in C2 C2 C1 C2 C1 C2 C1 4. Choose the object Ok with greatest D score. 5. If Dk>0, move Ok from C2 to C1, and repeat 3-5. 6. Otherwise, stop splitting process. …… C2 C1
Discussion on Hierarchical Approaches • Strengths • Do not need to input k, the number of clusters • Weakness • Do not scale well; time complexity of at least O(n2), where n is total number of objects • Can never undo what was done previously • Integration of hierarchical with distance-based clustering • BIRCH (1996): uses CF-tree and incrementally adjusts quality of sub-clusters • CURE (1998): selects well-scattered points from cluster and then shrinks them towards center of cluster by a specified fraction • CHAMELEON (1999): hierarchical clustering using dynamic modeling
How to Derive Clusters from Dendrogram • Use global thresholds • Homogeneity within clusters • Diameter(C) MaxD • Avg(sim(Oi,Oj)) ≥ (Oi,Oj C) • Separation between clusters • Inter-cluster distance ≥ • single-link • complete-link • …
Minimum Similarity Threshold Interactively Exploring Hierarchical Clustering Results, Seo, et al. 2002.
How to Derive Clusters from Dendrogram • Ask users to derive clusters • e.g. TreeView • Flexible when user have different requirement of cluster granularity for different parts of data. • Inconvenient when data set is large Coarse granularity Fine granularity