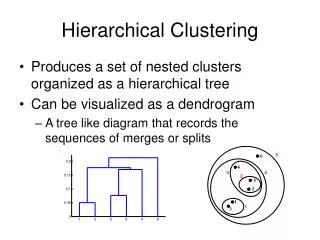
Hierarchical Clustering
Hierarchical Clustering . Week 7 - 1. Outline. Introduction Cluster Distance Measures Agglomerative Algorithm Example Labelling and Quality of Clusters Conclusions. Introduction . Hierarchical Clustering Approach

Hierarchical Clustering
E N D
Presentation Transcript
Hierarchical Clustering Week 7 - 1
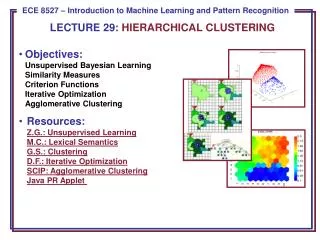
Outline • Introduction • Cluster Distance Measures • Agglomerative Algorithm • Example • Labelling and Quality of Clusters • Conclusions
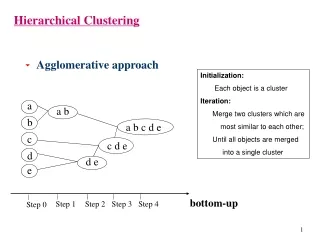
Introduction • Hierarchical Clustering Approach • A typical clustering analysis approach via partitioning data set sequentially • Construct nested partitions layer by layer via grouping objects into a tree of clusters (without the need to know the number of clusters in advance) • Uses distance matrix as clustering criteria • Agglomerative vs. Divisive • Two sequential clustering strategies for constructing a tree of clusters • Agglomerative: a bottom-up strategy • Initially each data object is in its own (atomic) cluster • Then merge these atomic clusters into larger and larger clusters • Divisive: a top-down strategy • Initially all objects are in one single cluster • Then the cluster is subdivided into smaller and smaller clusters
Step 0 Step 1 Step 2 Step 3 Step 4 Agglomerative a a b b a b c d e • Cluster distance • Termination condition c c d e d d e e Divisive Step 3 Step 2 Step 1 Step 0 Step 4 Introduction • Illustrative Example Agglomerative and divisive clustering on the data set {a, b, c, d ,e }
single link (min) complete link (max) average Cluster Distance Measures • Single link: smallest distance between an element in one cluster and an element in the other, i.e., d(Ci, Cj) = min{d(xip, xjq)} • Complete link: largest distance between an element in one cluster and an element in the other, i.e., d(Ci, Cj) = max{d(xip, xjq)} • Average: avg distance between elements in one cluster and elements in the other, i.e., d(Ci, Cj) = avg{d(xip, xjq)}
Cluster Distance Measures Single link Complete link Average Example: Given a data set of five objects characterised by a single feature, assume that there are two clusters: C1: {a, b} and C2: {c, d, e}. 1. Calculate the distance matrix. 2. Calculate three cluster distances between C1 and C2.
Agglomerative Algorithm • Convert object attributes to distance matrix • Set each object as a cluster (thus if we have N objects, we will have N clusters at the beginning) • Repeat until number of cluster is one (or known # of clusters) • Merge two closest clusters • Update distance matrix • The Agglomerative algorithm is carried out in three steps:
Example data matrix Euclidean distance distance matrix Problem: clustering analysis with agglomerative algorithm
Example Merge two closest clusters (iteration 1)
Example Update distance matrix (iteration 1)
Example Merge two closest clusters (iteration 2)
Example Update distance matrix (iteration 2)
Example Merge two closest clusters/update distance matrix (iteration 3)
Example Merge two closest clusters/update distance matrix (iteration 4)
Example Final result (meeting termination condition)
Example • In the beginning we have 6 • clusters: A, B, C, D, E and F • We merge clusters D and F into • cluster (D, F) at distance 0.50 • We merge cluster A and cluster B • into (A, B) at distance 0.71 • We merge clusters E and (D, F) • into ((D, F), E) at distance 1.00 • We merge clusters ((D, F), E) and C • into (((D, F), E), C) at distance 1.41 • We merge clusters (((D, F), E), C) • and (A, B) into ((((D, F), E), C), (A, B)) • at distance 2.50 • The last cluster contain all the objects, • thus conclude the computation 6 lifetime 5 4 3 2 object Dendrogram tree representation
Major issue - labeling • After clustering algorithm finds clusters - how can they be useful to the end user? • Need pithy label for each cluster • In search results, say “Animal” or “Car” in the jaguar example. • In topic trees (Yahoo), need navigational cues. • Often done by hand, a posteriori.
How to Label Clusters • Show titles of typical documents • Titles are easy to scan • Authors create them for quick scanning! • But you can only show a few titles which may not fully represent cluster • Show words/phrases prominent in cluster • More likely to fully represent cluster • Use distinguishing words/phrases • Differential labeling
Labeling • Common heuristics - list 5-10 most frequent terms in the centroid vector. • Drop stop-words; stem. • Differential labeling by frequent terms • Within a collection “Computers”, clusters all have the word computer as frequent term. • Discriminant analysis of centroids. • Perhaps better: distinctive noun phrase
What is a Good Clustering? • Internal criterion: A good clustering will produce high quality clusters in which: • the intra-class (that is, intra-cluster) similarity is high • the inter-class similarity is low • The measured quality of a clustering depends on both the document representation and the similarity measure used
External criteria for clustering quality Quality measured by its ability to discover some or all of the hidden patterns or latent classes in gold standard data Assesses a clustering with respect to ground truth Assume documents with C gold standard classes, while our clustering algorithms produce K clusters, ω1, ω2, …, ωK with nimembers.
Simple measure: purity, the ratio between the dominant class in the cluster πi and the size of cluster ωi Others are entropy of classes in clusters (or mutual information between classes and clusters) External Evaluation of Cluster Quality
Purity example Cluster I Cluster II Cluster III Cluster I: Purity = 1/6 (max(5, 1, 0)) = 5/6 Cluster II: Purity = 1/6 (max(1, 4, 1)) = 4/6 Cluster III: Purity = 1/5 (max(2, 0, 3)) = 3/5
Conclusions • Hierarchical algorithm is a sequential clustering algorithm • Use distance matrix to construct a tree of clusters (dendrogram) • Hierarchical representation without the need of knowing # of clusters (can set termination condition with known # of clusters) • Major weakness of agglomerative clustering methods • Can never undo what was done previously • Sensitive to cluster distance measures and noise/outliers • Less efficient: O (n2 ), where n is the number of total objects • There are several variants to overcome its weaknesses • BIRCH: uses clustering feature tree and incrementally adjusts the quality of sub-clusters, which scales well for a large data set • ROCK: clustering categorical data via neighbour and link analysis, which is insensitive to noise and outliers • CHAMELEON: hierarchical clustering using dynamic modeling, which integrates hierarchical method with other clustering methods
Distributed Hierarchical Clustering • Divide this task into following jobs • Calculate the distance matrix • Find the minimum distance entry in the matrix • Merge and update the matrix • Chaining jobs using their dependence relations