Water Quality
This detailed overview delves into water quality, pollution, sources of pollution, monitoring, categories of potential water pollutants, oxygen-demanding wastes, biological oxygen demand, and the importance of insects in assessing water quality.

Water Quality
E N D
Presentation Transcript
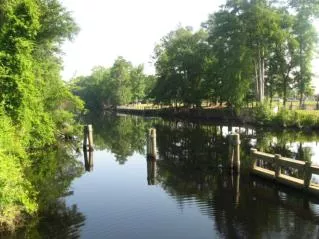
Water Quality Overview of Water Quality
Water Quality • Measure of what the water carries • Sediment • Oxygen and Oxygen Demanding Substances • Nutrients • Xenobiotics • Varies from place-to-place, time-to-time • Requires monitoring or proxies
What is Pollution? • An undesirable quantity of some constituent • Many are “natural” but enriched • Human-defined • Related to ecosystem change, aesthetics, health • Driven by perception as well as science • There are few well-defined functional thresholds for pollutants • Precautionary principle • Over-reaction and management costs • One size fits all (e.g. Numeric Nutrient Criteria)
What is Water Pollution • Any physical, biological, or chemical change in water quality that adversely affects living organisms can be considered pollution. • Point Sources- Discharge pollution from specific locations. • Factories, Power plants • Non-Point Sources- Scattered or diffuse, having no specific location of discharge. • Agricultural fields, Feedlots, Logging Operations
Point Sources • Easy to find • Easy to regulate • Easy to treat • Easy to monitor The Low Hanging Fruit - dealt with well already Non-Point Sources • Hard to measure • Hard to control • Hard to treat • Hard to monitor
Surface Water Urban runoff Agricultural Runoff Industrial Effluent Chemical/Oil Spills Municipal Effluent Air fallout Acid-mine drainage Logging operations Mills Atmospheric deposits Groundwater Gas tank leaks Landill leaching Agricultural Seepage Saltwater Intrusion Mine waste piles Atmospheric deposits Some Sources
Monitoring Water Quality • Total Maximum Daily Load • Load = Mass of Pollutant (per day) • Total = In All Forms over All Flows • Water body specific • Pollutant specific • “Concentration that will not cause an imbalance in flora and fauna” or “Failure to meet designated use” • Hard to specify with scientific certainty • Requires legal defense
Categories of Potential Water Pollutants • Organic Matter (sewage, garbage) • Pathogens (cholera, giardia, E. coli) • Organic chemicals (pesticides) • Nutrients (P and N from fertilizers) • Heavy Metals (mercury, lead etc. from urban runoff) • Acids (mine tailings, industrial spills) • Sediment (construction sites, erosion) • Heat (power plant cooling systems) • Radioactivity (gypsum stack runoff, military runoff)
Oxygen-Demanding Wastes (Biochemical Oxygen Demand) • Water with an oxygen content > 6 ppm will generally support desirable aquatic life. • Water with < 2 ppm oxygen will support mainly detritivores and decomposers. • Oxygen is added to water by diffusion from wind and waves, and by photosynthesis from green plants, algae, and cyanobacteria. • Oxygen is removed from water by respiration and oxygen-consuming processes. • Natural low oxygen environments exist in wetlands (abundant organic matter and bacteria)
Oxygen-Demanding Wastes • Biochemical Oxygen Demand (BOD) - Amount of dissolved oxygen consumed by microorganisms in degrading organic matter. • Effects of BOD on rivers depend on volume, flow, and temperature
Zone of Organic Matter Decomposition Oxygen Sag
Insect Guides to Water Quality • Insects are relatively immobile long-lived components of aquatic ecosystems • Water quality changes rapidly, and along many axes (DO, nutrients, contaminants) • Insects INTEGRATE the aquatic environment providing a useful indicator of water quality • Some insects are pollution “sensitive” • Others are pollution “tolerant” • Composition can be used to diagnos “health”
LESS MORE Pollution Tolerance Stoneflies (Plecoptera) Amphipods (Amphipoda) Mayflies (Ephemeroptera) Damselfly (Zygoptera) Caddisflies (Trichoptera) Dragonflies (Anisoptera) Blood worms (Chironomid)
Stream Condition Index • Quality of aquatic invertebrates • Composition • Abundance • Diversity • Scores from 0 to 50 • Quality of stream habitat • Vegetation and periphyton survey
A Problem of Geography • All Federal (that is “navigable”) waters have the same DO standard • The Suwannee River has very high levels of dissolved organic matter naturally • There are numerous wetlands that contribute to the flow (naturally low DO) • The river has gentle gradients • The priority water quality issue for the Suwannee is DO • Misplaced concern • Limitations of the one-size-fits-all approach to regluation
Nutrients and Eutrophication • Lake Trophic State • Oligotrophic - Bodies of water that have low nutrient concentration and therefore clear water and low biological productivity. • Eutrophic - Bodies of water that are rich in nutrients and, consequently, organisms and organic material. • Eutrophication - Process of increasing biological productivity (usually via the addition of nutrients). • Effects on water body primary productivity (fertilization) • Depletes dissolved oxygen • Leads to significant changes in ecological dynamics • May have human health consequences
Eutrophication • Def: Excess C fixation • Primary production is stimulated. Can be a good thing (e.g., more fish) • Can induce changes in dominant primary producers (e.g., algae vs. rooted plants) • Can alter dissolved oxygen dynamics (nighttime lows) • Fish and invertebrate impacts • Changes in color, clarity, aroma
Inducing Eutrophication Leibig’sLaw of the Minimum • Some element (or light or water) limits primary production (GPP) • Adding that thing will increase yields to a point; effects saturate when something else limits • What limits productivity in forests? Crops? Lakes? Pelagic ocean? (GPP) Justus von Liebig
Phosphorus limitation in shallow temperate lakes Nitrogen limitation in estuarine systems Nutrient Dose-Aquatic Systems V. Smith, L&O 2006 V. Smith, L&O 1982
Lake Apopka Hypereutrophic TN = 2,700 mg/m3 TP = 230 mg/m3 ChlA = 130
Lake Sheeler Oligotrophic TN = 70 mg/m3 TP = 4 mg/m3 ChlA =1 mg/m3
Eutrophication may stimulate the growth of algae that produce harmful toxins Microcystis bloom Red Tide
Nutrient Loads to the Land LanduseNitrogen LoadPhosphorus Loads Crops 350 kg/ha/yr 40 kg/ha/yr Pasture 125 kg/ha/yr 25 kg/ha/yr Lawn 280 kg/ha/yr 20 kg/ha/yr Forest 25 kg/ha/yr 2+ kg/ha/yr
Background NO3 is ~ 100 ppb (0.1 mg/L) Karst landscape is inherently vulnerable to NO3 loading and transport Unconfined aquifer areas are best sites for irrigated agriculture = FERTILIZERS N Concentrations in Springs
Protected Landsand Recharge Florida Natural Areas Inventory Data
Inorganic Pollutants • Metals • Many metals such as mercury, lead, cadmium, and nickel are highly toxic. • Highly persistent and tend to bioaccumulate in food chains. • Lead pipes are a serious source of drinking water pollution. • Mine drainage and leaching are serious sources of environmental contamination.
Inorganic Pollutants • Nonmetallic Salts • Many salts that are non-toxic at low concentrations can be mobilized by irrigation and concentrated by evaporation, reaching levels toxic to plants and animals. • Leaching of road salts has had detrimental effect on many ecosystems. • Acids and Bases • Often released as by-products of industrial processes.
Organic Chemicals • Thousands of natural and synthetic organic chemicals are used to make pesticides, plastics, pharmaceuticals, pigments, etc. • Two most important sources of toxic organic chemicals in water are: • Improper disposal of industrial and household wastes. • Runoff of pesticides from high-use areas. • Fields, roadsides, golf courses
Sediment • Human activities have accelerated erosion rates in many areas. • Human-induced erosion and runoff contribute about 75 billion metric tons of suspended solids to world surfaces each year. • Sediment can either be beneficial (nourish floodplains) or harmful (smother aquatic life).
A New Pollution • Hormones, medicines, etc. that are not treated during conventional treatment. • Prozac, birth-control hormones, pain killers • The effects of these in the environment is really unknown. A class of compounds called endocrine disruptors is of growing concern because of the effects they can have on the reproductive success of fish and amphibians.
Current Status of Water Quality • Areas of Progress • Clean Water Act (1972) established a National Pollution Discharge System which requires a permit for any entity dumping wastes in surface waters. • In 1999, EPA reported 91.4% of all monitored river miles and 87.5% of all accessed lake acres are suitable for their designated uses. • Most progress due to municipal sewage treatment facilities. Cuyahoga River in 1969. • Florida Water Resources Act (1972) established the Water Management Districts, the “local sources first” doctrine, the minimum flows and levels mandate and science-based watershed management entities • Administer TMDLs, MFLs, CUPs, 404-permits, wetland mitigation • Extensive scientific expertise (SJRWMD has over 50 PhD level scientists on staff)
Areas of Progress • In 1998, EPA switched regulatory approaches. Rather than issue standards on a site by site approach, the focus is now on watershed-level monitoring and protection. • States are required to identify waters not meeting water quality goals and develop total maximum daily loads (TMDLs) for each pollutant and each listed water body. • Often the designation of a TMDL is highly political.
Remaining Problems • Greatest impediments to achieving national goals in water quality are sediment, nutrients, and metals, especially from non-point discharges. • About three-quarters of water pollution in the US comes from soil erosion, air pollution fallout, and agricultural and urban runoff. • Single cow produces 30 kg manure/day. • Some feedlots have 100,000 animals.
Narrative vs. Numeric Criteria • Nutrients were historically regulated based on “narrative criteria” • Shall not cause an imbalance in the native flora and fauna • This is an inherently reactive system • EPA proposed (1/14/2010) to regulate nutrients in Florida (and elsewhere) based on “numeric criteria” • Preemptive protection • Recently finalized…LAW of the State of Florida
Next Time… • More on nutrients