Download
1 / 5
160 likes | 2.19k Vues
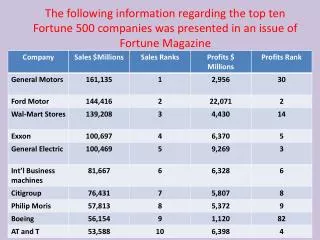
The following information regarding the top ten Fortune 500 companies was presented in an issue of Fortune Magazine. How many elements are in the above data set? How many variables are in this data set? How many observations are in this data set?

E N D
The following information regarding the top ten Fortune 500 companies was presented in an issue of Fortune Magazine
How many elements are in the above data set? • How many variables are in this data set? • How many observations are in this data set? • Which variables are qualitative and which are quantitative? • What measurements scale is used for each variable?
The following data shows the yearly income distribution of a sample of 200 employees at MNM. Inc.
(i) What percentage of employees has yearly income of $35,000 or more? • (ii) Is the figure(percentage) that you computed in (i) an example of statistical inference? If no, what kind of statistics does it represent? • (iii) Based on this sample the president of the company’s aid that 45% of all our employees yearly income are $35,000 or more. The president’s statement represents what kind of statistics? • (iv) With the statement made in (iii) can we assure that more than 45% of all employees yearly income are atleast $35,000? Explain
(v) What percentage of employees of the sample has yearly income of $29,000 or less? • (vi) How many variables are presented in the above data set? • (vii) The above data set represents the results of how many observations?


![How many nm are in a metre? [1]](https://cdn1.slideserve.com/2509766/slide1-dt.jpg)