PROFESSIONAL ASSET MANAGEMENT
230 likes | 453 Vues
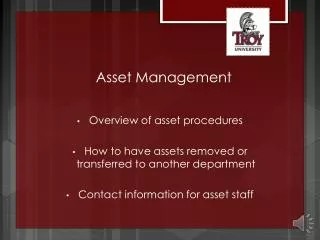
PROFESSIONAL ASSET MANAGEMENT. Basic Categories. Private Management : Clients each have a separate account {popular with institutions}. Investor 1. $. $$. Account 1 Account 2. Asset manager. $. Investor 2. Basic Categories.

PROFESSIONAL ASSET MANAGEMENT
E N D
Presentation Transcript
Basic Categories Private Management: Clients each have a separate account {popular with institutions} Investor 1 $ $$ Account 1 Account 2 Asset manager $ Investor 2
Basic Categories Investment Companies: Sell shares of the fund and invest the proceeds in a portfolio of stocks, bonds, or other assets Investor 1 Fund Shares $$ Fund Portfolio $ $ Asset manager Investor 2 Fund Shares
Professional Asset Management vs. Individuals 1. Diversification 2. Record Keeping 3. Professional Management 4. Lower Transaction Costs
Net Asset Value Example Market Value = $100 mil Number of Shares = 10 mil NAV = $100 / 10 = $10 / share Suppose Market Value goes up to $112.5 mil, and the management fees during that period were $0.1 mil. What is the ending NAV? NAV = (112.5 – 0.1) / 10 = $11.24 / share
Closed End Funds • Stock of the fund trades on the regular secondary market • Fund does not usually offer additional shares or repurchase shares • Fund is actively managed • NAV computed twice daily • Market price is NOT NECESSARILY EQUAL to NAV • Premium or discount reflects investors’ opinions of manager’s ability to select good investments in future • Poor history of long-run returns
Open-End (Mutual Fund) • Always willing to buy back (redeem) shares or sell additional shares at the NAV. • Shares may not be bought from or sold to anyone except the Fund. • Shares of the fund are always valued at NAV (calculated at the end of each day). • Total number of shares outstanding will change as fund sells/buys shares.
Loads: Sales Charge • Front End: Paid when shares are purchased. • 3% of NAV is typical • Back End: Paid when shares are redeemed • 5-10% fee on sale. Typically drops by 1% every year. • No-Load: No sales charge.
12b-1 Fees An alternative to a load to cover advertising & marketing expenses. Can be found in both loaded and no-load funds • Can deduct as much as .75% of assets annually to cover fund advertising & marketing.
Records Fees • Funds can charge as much as .25% of assets annually for records fees.
Management Fees • Range is typically .20% to 1.00%. • Does not include trading commissions
Expense Ratio Expense Ratio = Annual Expenses/$ Amt of Fund Assets Annual Expenses are: Management fees, 12b-1 fees, records fees (NOT front or back-end loads and not trading commissions)
Expense Ratio • Studies find that funds with lower expense ratios earn higher returns than those with higher expense ratios.
Turnover & Taxes • Turnover: Fraction of portfolio replaced each year. • Studies indicate that funds with a lower turnover achieve higher returns • Mutual funds have pass-through-status which means that taxes are paid only by the investor, not the mutual fund. • Investors can be taxed on gains they never received • Not an issue if in a tax-deferred retirement account
Performance • Many Studies find active managers (on average) underperform benchmarks after costs and fees by about 1% per year. • Good performance is associated with low expense ratio. • Very low correlation between top funds one year and top funds the next year. • Some positive correlation between bottom funds one year and bottom funds the next year. • Investors tend to put more money in funds that have recently done well • Investors in mutual funds tend to overweight growth stocks
ETFs • Exchange Traded Funds • Close-end index funds • Indexes for every sector, region and style • Most trade on AMEX • SPDR – S&P 500 • QQQQ – Nasdaq 100 • Low expense ratios • Trade like stocks • More transparent than mutual funds • Trade very close to NAV
Hedge Funds • Similar to Mutual Funds • Lightly Regulated • Only open to “Accredited” Investors • Not allowed to advertise • No secondary market • Not regularly marked-to-market due to illiquid investments • Can be highly leveraged • Often require a lockup period for investors
Investment Strategies • Long/Short – Market Neutral • Convertible Arbitrage • Merger Arbitrage • Statistical Arbitrage • Distressed Companies
Compensation Structure • Management Fee similar to mutual funds • Performance Fee – typically 20% of profits • Leads to emphasis on absolute return rather than relative return
Results • Often difficult to know for sure • Some appear to be very high • Some studies say the industry averages no better than mutual funds • Additional fees can cut into positive results – Especially funds of funds