Download
1 / 34
340 likes | 363 Vues
Explore techniques using exoplanet transits to analyze 3-D stellar atmospheres, revealing hidden segments of stellar disks. Differential spectroscopy unveils spectral changes and line profiles, shedding light on atmospheric structures.

E N D
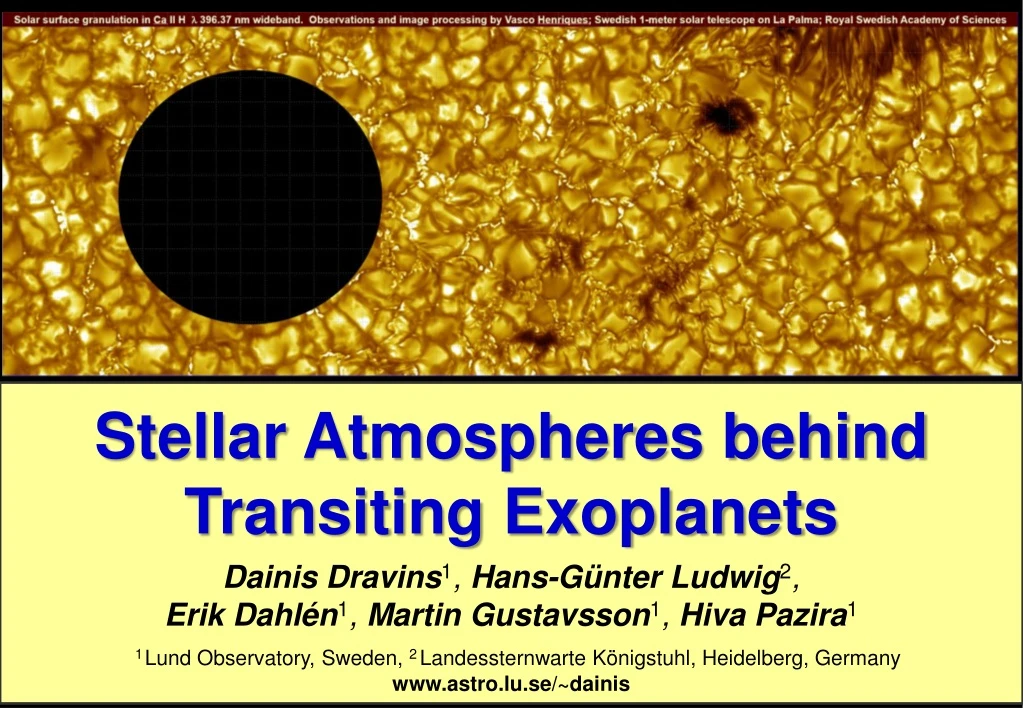
KVA Stellar Atmospheres behind Transiting Exoplanets Dainis Dravins1, Hans-Günter Ludwig2, Erik Dahlén1, Martin Gustavsson1, Hiva Pazira1 1Lund Observatory, Sweden, 2LandessternwarteKönigstuhl, Heidelberg, Germany www.astro.lu.se/~dainis
Know Thy Star – Know Thy Planet Know thy enemy! What (besides exoplanets) is shifting stellar spectral lines? Exoplanet atmospheric signatures? Exoplanet properties deduced differentially to stellar spectra • Finding “true” Earth analogs? • Stellar variability much greater than planetary perturbation
A REAL STAR Granulation near the limb (towards the top) at 488 nm; Swedish 1-m solar telescope, La Palma
MODELING STELLAR SURFACES Surface intensity during granular evolution on a 12,000 K white dwarf (left) and a 3,800 K red giant. Areas differ by orders of magnitude: 7x7 km2 for the white dwarf, and 23x23 RSun2 for the giant. D.Dravins, H.-G.Ludwig, E.Dahlén, H.Pazira: Spatially resolved spectroscopy across stellar surfaces. I. Using exoplanet transits to analyze 3-D stellar atmospheres Astron.Astrophys. (2017)
How to verify or falsify 3-D models?
Spatially resolved spectra across stellar granulation Spatially resolved line profiles of the Fe I 608.27 nm line in a 3-D solar simulation. Thick red line is the spatially averaged profile. The steeper temperature structures in hotter upflowstend to make their lines stronger (blue-shifted components). M.Asplund: New Light on Stellar Abundance Analyses: Departures from LTE and Homogeneity, Ann.Rev.Astron.Astrophys. 43, 481
Spatially averaged spectra across stellar granulation Spatially averaged line profiles from 20 timesteps, and temporal averages. = 620 nm = 3 eV 5 line strengths GIANT STAR Teff= 5000 K log g [cgs] = 2.5 (approx. K0 III) Stellar disk center; µ = cos = 1.0 (D.Dravins, H.-G.Ludwig, E.Dahlén, H.Pazira, Proc. 18th Cambridge Workshop on Cool Stars, Stellar Systems, and the Sun, 2014)
Line profiles from 3-D hydrodynamic simulations Synthetic Fe I profiles from a CO5BOLD model for a dwarf star with Teff= 6730 K. Three line strengths; = 3 eV, = 620 nm. Solid: Disk center µ = cos = 1; dashed near limb, µ = 0.21. Lines are broader near the limb since horizontal motions are greater than vertical ones. D.Dravins, H.-G.Ludwig, E.Dahlén, H.Pazira: Spatially resolved spectroscopy across stellar surfaces. I. Using exoplanet transits to analyze 3-D stellar atmospheres Astron.Astrophys. (2017)
Spectral line profiles across stellar disks Spectral lines, spatially and temporally averaged from 3-D models, change their strengths, widths, asymmetries and convective wavelength shifts across stellar disks, revealing details of atmospheric structure. These line profiles from disk center (µ = cos= 1) towards the limb are from a CO5BOLD model of a main-sequence star; solar metallicity, Teff= 6800 K. (D.Dravins, H.-G.Ludwig, E.Dahlén, H.Pazira, Proc. 18th Cambridge Workshop on Cool Stars, Stellar Systems, and the Sun, 2014)
Spatially resolving stellar surfaces using exoplanet transits Differences during exoplanet transit reveal temporarily hidden stellar surface segments. Changing continuum flux measured by photometry, spectral changes by spectroscopy. D.Dravins, H.-G.Ludwig, E.Dahlén, H.Pazira: Spatially resolved spectroscopy across stellar surfaces. I. Using exoplanet transits to analyze 3-D stellar atmospheres Astron.Astrophys. (2017)
Stellar Spectroscopy • during Exoplanet Transits • * Exoplanets successively hide segments of stellar disk • * Differential spectroscopy provides spectra of those • surface segments that were hidden behind the planet • * 3-D hydrodynamics studied in center-to-limb variations of line shapes, asymmetries and wavelength shifts • * Retrieving good spectra from behind exoplanet covering ~1% of star requires S/N ~10,000 (!)
Transiting exoplanet hosts & KELT-20b 0.8% mV~7.6 A2 V Photometric transit depth for transiting exoplanet systems. Symbol diameters are proportional to the duration of transit. D.Dravins, H.-G.Ludwig, E.Dahlén, H.Pazira: Spatially resolved spectroscopy across stellar surfaces. II. High-resolution spectra across HD 209458 (G0 V) Astron.Astrophys. (2017)
Exoplanet transit geometry G.Torres, J.Winn, M.J.Holman: Improved Parameters for Extrasolar Transiting Planets, ApJ677, 1324
Spectrum of HD209458 resembles solar D.Dravins, H.-G.Ludwig, E.Dahlén, H.Pazira: Spatially resolved spectroscopy across stellar surfaces. II. High-resolution spectra across HD 209458 (G0 V) Astron.Astrophys. (2017)
Averaging photospheric Fe I lines Photospheric Fe I lines of similar strengths in HD209458 carry redundant information. Averaging multiple exposures gives a representative profile with λ/ λ 80,000, S/N 7,000. D.Dravins, H.-G.Ludwig, E.Dahlén, H.Pazira: Spatially resolved spectroscopy across stellar surfaces. II. High-resolution spectra across HD 209458 (G0 V) Astron.Astrophys. (2017)
Retrieving spatially resolved stellar line profiles
Principle of spectral reconstruction Spectrum behind the planet is obtained as that line profile (weighted with the amount of flux temporarily obscured) that – summed with the temporarily observed profile – produces the profile outside of transit D.Dravins, H.-G.Ludwig, E.Dahlén, H.Pazira: Spatially resolved spectroscopy across stellar surfaces. II. High-resolution spectra across HD 209458 (G0 V) Astron.Astrophys. (2017)
Exoplanet transit geometry Planet size and positions during an observing night D.Dravins, H.-G.Ludwig, E.Dahlén, H.Pazira: Spatially resolved spectroscopy across stellar surfaces. II. High-resolution spectra across HD 209458 (G0 V) Astron.Astrophys. (2017)
Observed changes of an Fe I line during transit Profiles (26-line averages) at 14 successive positions during the exoplanet transit; photometric S/N ~2,500 D.Dravins, H.-G.Ludwig, E.Dahlén, H.Pazira: Spatially resolved spectroscopy across stellar surfaces. II. High-resolution spectra across HD 209458 (G0 V) Astron.Astrophys. (2017)
Observed changes of an Fe I line during transit Ratios of observed line profiles to that from outside transit. Sequence starts with the planet already in transit. Time increases from top down. Profiles are 26-line averages of Fe I lines in HD 209458. D.Dravins, H.-G.Ludwig, E.Dahlén, H.Pazira: Spatially resolved spectroscopy across stellar surfaces. II. High-resolution spectra across HD 209458 (G0 V) Astron.Astrophys. (2017)
Retrieved line profiles across HD 209458 Reconstructed profiles for an Fe I line at 11 locations across the disk of HD 209458. Spatially resolved lines are not rotational broadened and are deeper than the disk average outside transit (dashed gray). During transit, the profiles shift in wavelength, illustrating stellar rotation and prograde orbital motion of the exoplanet. D.Dravins, H.-G.Ludwig, E.Dahlén, H.Pazira: Spatially resolved spectroscopy across stellar surfaces. II. High-resolution spectra across HD 209458 (G0 V) Astron.Astrophys. (2017)
Retrieved line profiles across HD 209458 Solid blue: near disk center, dashed brown: closer to limb. Spatially resolved lines are not rotational broadened and are deeper than the disk average. Wavelength shift during transit illustrates stellar rotation and prograde orbital motion of the exoplanet. Planet size and positions on the stellar disk are to scale. D.Dravins, H.-G.Ludwig, E.Dahlén, H.Pazira: Spatially resolved spectroscopy across stellar surfaces. II. High-resolution spectra across HD 209458 (G0 V) Astron.Astrophys. (2017)
Stronger & weaker Fe I lines in HD 209458 Spectral lines become broader, shallower, and weaker from stellar disk center toward the limb D.Dravins, H.-G.Ludwig, E.Dahlén, H.Pazira: Spatially resolved spectroscopy across stellar surfaces. II. High-resolution spectra across HD 209458 (G0 V) Astron.Astrophys. (2017)
Comparing Fe I lines to 3-D models Observed and modeled line-depths and widths (CO5BOLD models with parameters bracketing those of HD209458). From disk center towards the limb, lines are predicted to become shallower and broader, consistent with observations. D.Dravins, H.-G.Ludwig, E.Dahlén, H.Pazira: Spatially resolved spectroscopy across stellar surfaces. II. High-resolution spectra across HD 209458 (G0 V) Astron.Astrophys. (2017)
Find a ‘true’ Earth-analog? Induced stellar Vrad~10 cm/s Transit depth ~10-4 Calibrate stellar microvariability?
Stellar surface granulation varies among stars F3 V F7 V K8 V Modeled bisectors show spectral line asymmetries for stars hotter and cooler than the Sun. Top: Lines of different strength at stellar disk centers; Bottom: Near the limb. D.Dravins, H.-G.Ludwig, E.Dahlén, H.Pazira: Spatially resolved spectroscopy across stellar surfaces. I. Using exoplanet transits to analyze 3-D stellar atmospheres Astron.Astrophys. (2017)
A cooler star with a quieter surface: HD189733A (K1 V)
Spectrum of HD189733A (K1 V) Spectrum of HD189733A (‘Alopex’); K1 V at ~4800 K resembles that of the well-studied giant Arcturus (K1 III), ~4300 K D.Dravins, M.Gustavsson, H.-G.Ludwig: Spatially resolved spectroscopy across stellar surfaces. III. High-resolution spectra across HD 189733A (K1 V) Astron.Astrophys., in preparation
Fe I lines in HD189733A (K1 V) Averaging 158 Fe I lines over many HARPS exposures produces a representative profile (S/N ~9 000) D.Dravins, M.Gustavsson, H.-G.Ludwig: Spatially resolved spectroscopy across stellar surfaces. III. High-resolution spectra across HD 189733A (K1 V) Astron.Astrophys., in preparation
Reconstructed profiles across HD189733A Left: Exoplanet transit geometry to scale Reconstructed (and curve-fitted) Fe I line profiles at different positions across the disk of HD 189733A. D.Dravins, M.Gustavsson, H.-G.Ludwig: Spatially resolved spectroscopy across stellar surfaces. III. High-resolution spectra across HD 189733A (K1 V) Astron.Astrophys., in preparation
Stellar Spectroscopy during Exoplanet Transits * Now: Marginally feasible with, UVES @ VLT, HARPS * Immediate future: PEPSI @ LBT * Near future: ESPRESSO @ VLT * Future: HIRES @ ELT ? Anytime soon: More exoplanets transiting bright stars


