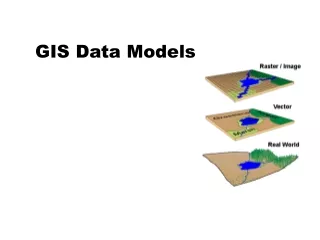
Enhancing GIS Data Quality: Business Processes & Best Practices
520 likes | 576 Vues
This course focuses on improving data quality in GIS through robust business processes, covering topics like data assessment, metadata utilization, and data profiling metrics. Participants will learn to build a data quality system, prevent common pitfalls, and manage project scopes effectively. With examples from past projects and practical exercises, the course emphasizes the importance of data accuracy, completeness, and consistency. By the end, attendees will be equipped with skills to monitor, assess, and enhance the quality of GIS data to optimize decision-making and planning processes.

Enhancing GIS Data Quality: Business Processes & Best Practices
E N D
Presentation Transcript
GIS Data Quality Producing better data quality through robust business processes BrightStar TRAINING Kim Ollivier
Schedule Day One Suggested breaks for the following times: Start: 9:00 Session 1 ( 90 min) Morning tea: 10:30 to 10:45 Session 2 ( 105 min) Lunch: 12:30 to 1:30 Session 3 ( 90 min) Afternoon tea: 3:00 to 3:15 Session 4 ( 105 min) Finish: 5:00 Each session will have an exercise or interactive discussion
Today • Introduction • What causes poor quality • Lunch • Assessing Quality processes • GIS upgrade project examples
Tomorrow • Metadata • Designing rules • Lunch • Data warehouse and ETL • Feature maintenance
Overview • Introduce yourself • Your goals for this course? • Build a data quality system • Avoid the worst traps • Be able to describe a project scope • Budget, timeline, priorities
Sections of course based on With permission from the author ISBN 978-0-09771400-2
What is Data Quality? “If they are fit for their intended uses in operations, decision making and planning.” “If they correctly represent the real-world construct to which they refer.”
Statistical Accuracy False Positives False negatives Completeness Score = Relevant Relevant + Missing Accuracy Score = Relevant - Errors Relevant Overall Score = Relevant - Errors Relevant + Missing
Completeness • LINZ Bulk Data Extract • metadata\meta.html
Data Profiling • Find out what is there • Assess the risks • Understand data challenges early • Have an enterprise view of all data
Profile Metrics • Integrity • Consistency • Completeness, Density • Validity • Timeliness • Accessibility • Uniqueness
Security • Confidentiality • Possession • Integrity • Authenticity • Availability • Utility
Consistency • Discrepancies between attributes • Exceptions in a cluster • Spatial discrepancies
A GIS Data Quality System Assess Data Quality Assessment Data Profiling Improve Recognise Prevent Data Cleaning Monitoring Data Integration Interfaces Ensuring Quality of Data Conversion and Consolidation Building Data Quality Metadata Warehouse Monitor Recurrent Data Quality Assessment
Course examples • LINZ coordinate upgrade 1998-2003 • NSCC services upgrade 2008 • Valuation roll structure and matching • ETL of utilites from SDE to Autocad • Address location issues NAR, DRA Documents and examples on memory stick
Exercise 1:Nominate your database Select a representative example dataset for later discussion • You may be responsible for • Or, you have to integrate • Or, you have to load it • Or, you supply it to others Morning Tea
Assessing Quality • Project steps • Required roles • Defining the objectives • Designing rules • Scorecard and Metadata • Frequency of assessment • Common mistakes
Processes causing data decay Processes bringing data from outside Initial Data Conversion Changes not captured System Upgrades System Consolidations New Data Uses Manual Data Entry Loss of Expertise Batch Feeds Process Automation Real-Time Interfaces Processes Affecting Data Quality Database Processes changing data from within Data processing Data cleaning Data purging
Outside: Initial Data Conversion • Define data mapping • Extract, Transform, Load (ETL) • Drown in Data Problems • Find Scapegoat
Outside: System Consolidation • Often from mergers (Auckland?) • Unplanned, unreasonable timeframes • Head-on two car wreck • Square pegs into round holes • Winner – loser merging (50% wrong)
Outside: Manual Data Entry • High error rate • Complex and poor entry forms • Users find ways around checks • Forcing non blanks does not work
Outside: Batch Feeds • Large volumes mean lots of errors • Source system subject to changes • Errors accumulate • Especially dangerous if triggers activated
Outside: Real-Time Interfaces • Data between db’s in synchronisation • Data in small packets out of context • Too fast to validate • Rejection loses record, so accepted • Faster or better but not both!
Decay: Changes Not Captured • Object changes are unnoticed by computers • Retroactive changes may not be propagated
Decay: System Upgrades • The data is assumed to comply with the new requirements • Upgrades are tested against what the data is supposed to be, not what is actually there • Once upgrades are implemented everything goes haywire
Decay: New Data Uses • “Fitness to the purpose of use” may not apply • Acceptable error rates may now be an issue • Value granularity, map scale • Data retention policy
Decay: Loss of Expertise • Meaning of codes may change over time that only “experts” know • Experts know when data looks wrong • Retirees rehired to work systems • Auckland address points were entered on corners and the rest guessed, later used as exact.
Decay: Process Automation • Web 2.0 bots automate form filling • Transactions are generated without ever being checked by people • Customers given automated access are more sensitive to errors in their own data
Within: Data Processing • Changes in the programs • Programs may not keep up with changes in data collection • Processing may be done at the wrong time
Special GIS Data Issues • Coordinate data not usually readable • Data models CAD v GIS • Fuzzy matching is not Boolean (near) • Atomic objects harder to define • Features have 2,3,4,5 dimensions • Projection systems are not exact • Topology requires special operators
Within: Data Purging • Highly risky for data quality • Relevant data may be purged • Erroneous data may fit criteria • It may not work the next year
Within: Data Cleaning • En masse processes may add errors • Cleaning processes may have bugs • Incomplete information about data
Assessing Data Quality • Data profiling • Interview users • Examine data model • Data Gazing
Data Gazing • Count the records • Just open the sources and scroll • Sort and look at the ends • Run some simple frequency reports • See if the field names make sense • What is missing that should be there Lunch
Data Cleaning • There are always lots of errors • It is too much to inspect all by hand • Data experts are rare and too busy • It does not fix process errors • You may make it worse
Automated Cleaning • The only practical method • Needs sophisticated pattern analysis • Allow for backtracking • Data quality rules are interdependent
Common Mistakes • Inadequate Staffing of Data Quality Teams • Hoping That Data Will Get Better by Itself • Lack of Data Quality Assessment • Narrow Focus • Bad Metadata • Ignoring Data Quality During Data Conversions • Winner-Loser Approach in Data Consolidation • Inadequate Monitoring of Data Interfaces • Forgetting About Data Decay • Poor Organization of Data Quality Metadata
Metadata • Data model • Business rules, relations, state • Subclasses (lookup tables) • GIS Metadata (NZGLS or ISO) XML • Readme.txt Includes everything known about the data
Data Exchange • Batch or interactive • ETL (Extract Transform Load) • Replication • Time differences in data
GIS in Business Processes • Integrates many different sources • Spatial patterns are revealed • Display thousands of records simultaneously with direct access • Location now seen as important
Scorecard DQ Score Score Summary Score Decompositions Intermediate Error Reports Atomic Level Data Quality Information
Case Study • Outline a GIS data quality system • Measles Chart • Prioritise • Interview • Build up a scorecard Afternoon Tea
Assessment Exercise • Split into pairs • Interview one person about their dataset • Collect basic information • Devise a strategy for a profile • Rotate pair with another • Interview other person • Verbal reports to class
Major Upgrade Projects • LINZ Coordinate upgrade • NSCC Coordinate upgrade
References • Data Quality Assessment – Arkady Maydanchik