Download
1 / 75
760 likes | 780 Vues
This analysis covers the trade balance, flows, and trends in the aluminum industry, focusing on the impact of China's overproduction, downstream sectors, demand growth, and global trade measures. It examines the value chain, capacity growth, inventories, pricing, and market dynamics in the US, China, and worldwide.

E N D
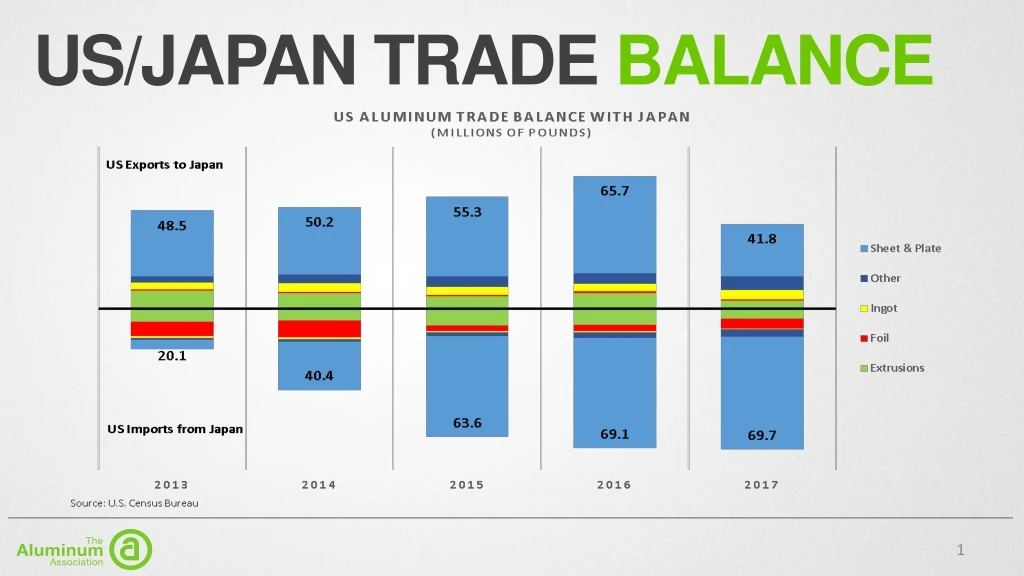
Imports from the EU U.S. Import of Aluminum Products Covered Under the 232 (Metric Tons) Source: U.S. Census Bureau
Imports from the EU Source: U.S. Census Bureau
The Aluminum valuechain:primary, millproducts, and everything in-between
Aluminum value chain Includes the primary sector, semi-finished products, and end products
Aluminum value chain Changing focus throughout the value chain Pricing throughout the Aluminum Value Chain
Downstream up; upstream down While upstream segments of the industry have seen major job losses in recent years largely due to the continued overproduction of aluminum in China, these losses have been offset by gains in downstream sectors like flat-roll products, extruded products, foundries and metal service centers.
Demand growth Continues Demand up an estimated 2.7 % y/y • Surpassing mid-2000s record levels Demand is up 45% since 2009 Apparent consumption up nearly 4% y/y
Themarketfor Aluminum • Containers & Packaging down 1% Y/Y, and off 3% since 2009 • Transportation market up 3.4% Y/Y and 123% since 2009 • Building & Construction up 4.1% Y/Y and 30% since 2009
U.S. ScrapExports Exports reached 1.75 million lbs ytd (Jan-Jun), up roughly 12% over like-2017
Continued Capacity growth in China • In 2017, China’s primary aluminum capacity reached 45.2 million tons. • Growing an estimated 8.9% over the 2016 level. • This trend has continued through July 2018 (+7% YTD) • Over the last five years, China’s capacity has grown 72.8% • While production has only grown 63.2%. +8.9% 45.2mt Data: CRU
COMPARED TO Capacity growth in ROW • In 2017, the Rest of the World’s primary aluminum capacity reached 32.5 million tons. • Falling roughly 0.7% y/y. • Over the last five years, RoW capacity has grown 2.1%. • While production has grown 5.7%. • RoW capacity has increased 0.8% YTD 2018. 45.2mt 32.5mt -0.7% Data: CRU
Continued Capacity growth in China • Capacity continues to outpace consumption in China. • ↑ to nearly 11mmt in 2017 • That’s roughly 6x total U.S. capacity. • Capacity in excess of consumption in 2017 was equivalent to roughly 33% of capacity in RoW. • China’s utilization rate ≈ 75% YTD Data: CRU
Chinese inventories Continue to grow • With production growing, Chinese primary stocks* have reached a record level of nearly 5.4 million tons in March 2018. • An increase of 26.6% Q/Q. • RoW stocks are off 21.4% Q/Q. • Chinese Stocks have increased in 18 of the last 19 months. • Based consumption levels, Q1 2018 stocks = 56 days, up from 47 y/y.
China’sovercapacitysituation Chinese Excess Capacity Weighing on Global Market Chinese excess capacity in 2017 was estimated at roughly 40% of production in the RoW.
Primaryexportduties & vatRebate Tax Policies Incentivizing Downstream (Semi-fabricated) Exports* Chinese Semi-fabricated Product VAT Rebate Chinese Aluminum-Related Export Duties * As of End of 2015
Huge Investment in Aluminum Downstream Capacity in China DownstreamCapacitybuildcontinues Source: Antaike
Huge Investment in Aluminum Rolled Product Capacity in China State of Roll Productsin China • Capacity has increased from 9.5 million metric tonnes/year in 2012 to an estimated 15.8 million tonnes/year in 2016. This is forecast to grow to approximately 19.2 million tonnes/year by 2020. • The consumption of aluminum rolled products in China has increased but at a much slower rate; 6 million metric tonnes per year in 2012, 8.6 million tonnes estimated in 2016 and 10.2 million tonnes forecast for 2020.
Similarly, Chinese extrusion capacity significantly outpacing production State of extrusionsin China Source: Hydro, Antaike: 2017 • Extrusion capacity in China has increased from 5.2 million metric tonnes/year in 2005 to an estimated 26.5 million tonnes/year in 2016. • At the same time, consumption of aluminum extruded products in China has increased but at a much slower rate; 3.4 million metric tonnes per year in 2005, to 17.3 million tonnes in 2016.
Overcapacity in China:…Leading to marketdistorting and ilegal behavior
Trends in thePricefor Aluminum MWP = ¢21/Lb MWP = ¢9/Lb LME + MWP LME Cash
Aluminum MWP 2018 YTD Change: 128.9% • Percent Change YTD for Aluminum MWP and Contextual Commentary Source: Arconic GMI, Platts, Bloomberg, Reuters, Harbor, CRU
Price fluctuations align with market events LME aluminum and FOB WA alumina prices, Jan-Jun 2018 ($/t) Source: Alcoa Analysis INTERNAL USE LME Easing of UC Rusal Sanctions (4/23) FOB WA Escalation of trade tensions (5/29) Rumors of US Tariff Considerations (1/18) End of MEP Winter Cuts (3/15) FOB WA Alumina Section 232 Tariffs (3/23) LME Chinese Alumina Export Window Opens (3/28) Chinese Alumina Export Window Closes (5/18) DOC Releases Report (2/18) Alunorte Curtailment (3/1) UC Rusal Sanctions Announced (4/6) 12/28 1/11 1/25 2/8 2/22 3/8 3/22 4/5 4/19 5/3 5/17 5/31 6/14 6/28 7/12
LME CASH PRICE 2000 – 2018 YTD ($/MT) Global financial crisis 2008-2009 Trade-related volatility2018 China conditions for surplus begin 2011 Strong demand 2005-2007 China temporary curtailments begin2017 China emerges as producer 2000 Source: Trading Economics, Oct. 2018. Not adjusted for inflation.
LME CASH PRICE 2017 – 2018 YTD ($/MT) Rusal sanctions implementation delayed Apr. 23 Alunorte full curtailment announced (Oct. 3) followed by intent to reopen (Oct. 8) Revised $50B 301 list published June 15 US and Mexico announce trade deal without Canada Aug. 26 DOC releases reportFeb. Chinese winter cuts less than anticipated Nov. ‘17 Alunorte refinery curtailed 50%March 1 US announces add’t $200B in tariffs on China July 10 Rumors of US tariff consideration Jan. ‘18 232 tariffs announced March 1 Chinese Yuan hits 13-month low July 24 Rusal sanctions announced, Apr. 6 Source: Trading Economics, Oct. 2018. Not adjusted for inflation.
Growth in ChineseImports Decline from 2015 to 2016 due to the suspension of irregular and nontransparent trade practices (i.e. fake-semis). In this case, primary aluminum disguised as aluminum plate. Antidumping/Countervailing Duties imposed on Chinese imports of extruded products 16
Thevalue of our trading partnersimports: A vital component of supply
Supplyingthe metal Exports Unused Capacity 3.4mmt = Deficit After Restart of Idled Capacity 4.5mmt = 2017 Deficit
Tariffs drive limited smelter restarts, imports remain vital U.S. Primary aluminum market estimates and update Est. U.S. Primary aluminum supply, Mmt Challenges and solutions for U.S. smelting U.S. remains an import market • 232 tariffs supported restart of 0.3 Mmtpa of curtailed U.S. competitors’ capacity in 5.7 Mmtpa U.S. market • Alcoa’s Warrick restart based on integrated site cost efficiencies; Alcoa has remaining curtailed capacity at Wenatchee, Warrick and Intalco • If all remaining curtailed U.S. capacity restarts, U.S. will still import ~4 Mmtpa, ~60% from Canada 232 tariffs yield mixed results • U.S. aluminum producers benefit from higher premiums • Distorts market by bringing aged, inefficient capacity on line; newest U.S. smelter is ~40 years old • Increases costs for U.S. downstream manufacturers What would make aluminum investment attractive • Lower capital investment requirements, long-term energy solutions and competitive regulatory environment Source: CRU, company reports and Alcoa analysis. Alcoa U.S. operating capacity Competitor U.S. operating capacity Net imports and inventory consumption 0.5 5.7 5.4 0.3 (0.2) 0.2 4.4 4.6 0.4 0.8 0.4 0.5 2017 Publicly announced restarts Change in net imports and inventory consumption Est. 2019 run-rate Curtailed Capacity, Mmt Alcoa U.S. 0.5 0.3 U.S. Competitors 0.5 0.2 Slide from Alcoa 2Q 2018 Earnings


