HR Metrics
HR Metrics . Dashboard Reporting. Our Situation. A wide variety of data sources and formats Mainly just list-style reporting Inability to report on multiple levels or to slice the data into different views. Inconsistent tracking and data management

HR Metrics
E N D
Presentation Transcript
HR Metrics Dashboard Reporting
Our Situation • A wide variety of data sources and formats • Mainly just list-style reporting • Inability to report on multiple levels or to slice the data into different views. • Inconsistent tracking and data management • Reporting of any data was largely reactive
What We Needed • A common and consistent reporting tool that could draw from existing data sources • More dynamic, up to date reporting • Ability to report on multiple levels and with multiple views (slice and dice) • Ability to report proactively and to do trending
What We Did • Established a planning function within HR as part of a new service delivery model • Hired a planner with a data oriented skill-set • Extracted all data to common reporting tool (Excelsius) • Shifted to a dashboard concept
The Consultant Team • No one person or function in HR can deliver this new model alone Specialist Generalist The “So What” Subject expertise Source of raw data The “Now What” Builds relationships Knows the client’s business Client Planner The “What” Analyzes source data Coordinates Corp HR Projects
Our Client Planner Generalist Specialist • They draw on the strength of each other to enhance their own role • These three functions are equal • They depend on each other to survive • They each bring something to the client table The three legged stool
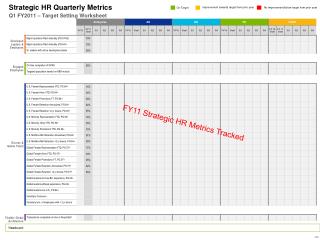
How does our new metrics model work? • Built on a core set of ‘executive’ metrics • Executive metrics can be mined by organization and by demographic • Each metric has a detailed view with data and graphics • Data is refreshed regularly • Many variables can be viewed with just a few clicks
Dashboard Tour • A few sample views of the reporting tool
So What Does This Mean? • HR staff now have fast access to consistent data through a desktop icon • Specialists can mine data and see trends in their areas of expertise • Generalists can look up program specific metrics for their clients • Corporate reporting (HRBN, OMBI) now takes minimal effort
Next Steps • Check data integrity in 2011 • Move to the “So What” phase • HR Generalists/Specialists start using data for their programs and stakeholders • Move to proactive instead of reactive reporting • Generate an annual Senior Management Report