Download
1 / 21
210 likes | 354 Vues
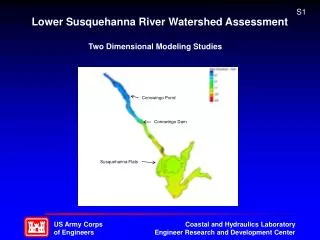
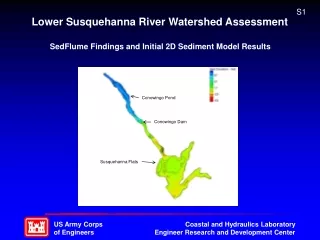
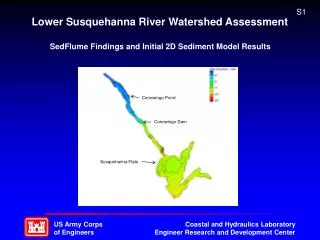
S1. Lower Susquehanna River Watershed Assessment. SedFlume Findings and Initial 2D Sediment Model Results. Conowingo Pond. Conowingo Dam. Susquehanna Flats. S2. Lower Susquehanna River Watershed Assessment. Topics: SedFlume Field Activities and Data Analysis

E N D
S1 Lower Susquehanna River Watershed Assessment SedFlume Findings and Initial 2D Sediment Model Results Conowingo Pond Conowingo Dam Susquehanna Flats
S2 Lower Susquehanna River Watershed Assessment • Topics: • SedFlume Field Activities and Data Analysis • Preliminary Sediment Transport Results with SedFlume Data
S3 Lower Susquehanna River Watershed Assessment • SedFlume Description • Field – Portable Laboratory Flume • Used to Evaluate Erosion Rate and Critical Shear of Cohesive Sediments
S4 Lower Susquehanna River Watershed Assessment SedFlume Operations
S5 Lower Susquehanna River Watershed Assessment Description of Sediment Coring Process
S6 Lower Susquehanna River Watershed Assessment Sampling Locations in Conowingo Reservoir
S7 Lower Susquehanna River Watershed Assessment • SedFlume Analysis • Core Lengths Varied From Approximately 6 – 12 inches • The Entire Core was Analyzed • Erosion Rate Coefficients and Exponents Evaluated by Layer • Along with Critical Shear Stress for Erosion • Core Bulk Density and Particle Size Distribution Evaluated
S8 Lower Susquehanna River Watershed Assessment SedFlume Analysis Results
S9 Lower Susquehanna River Watershed Assessment Example of SedFlume Results
S10 Lower Susquehanna River Watershed Assessment • Core Physical Properties • Bulk Density Range – 1320 kg / m3 to 1500 kg / m3 • Sediment Fractions • Sand: 10% - 45% • Silt: 50% - 82% • Clay: 5% - 9%
S11 Lower Susquehanna River Watershed Assessment • SedFlume Data Assigned by Material Type in Model • Model Domain Divided into Areas Based on Change in Properties • Three Layers Assigned in Model Using Average SedFlume Data • Average Sediment Size Fractions Assigned to Layers
S12 Lower Susquehanna River Watershed Assessment Material Designation in AdH Model
S13 Lower Susquehanna River Watershed Assessment 2D Model Development – 2008 Bathymetry
S14 Lower Susquehanna River Watershed Assessment • Preliminary Sediment Transport Simulation • Evaluate the 2008 – 2011 Susquehanna River Flows • Period of Record Includes the September 2001 Tropical Storm Lee Event • Sediment Inflows Estimated From Previous HEC-6 Modeling
S15 Lower Susquehanna River Watershed Assessment 2008 – 2011 Susquehanna Flow Record
S16 Lower Susquehanna River Watershed Assessment Sediment Rating Curve for 2008 – 2011 Simulation
S17 Lower Susquehanna River Watershed Assessment Simulated Sediment Load in and out of Conowingo Reservoir: 2008 – 2011 Assumptions: Top 1 ft layer critical Shear = 2 Pa Below 1 ft layer critical shear = 4 Pa Total In: 12 million tons Total Out: 16.6 million tons Net Scour: 4.6 million tons
S18 Lower Susquehanna River Watershed Assessment Computed Bed Shear Stress for 300,000 cfs
S19 Lower Susquehanna River Watershed Assessment Computed Bed Shear Stress for 400,000 cfs
S20 Lower Susquehanna River Watershed Assessment Computed Bed Shear Stress for 600,000 cfs
S21 Lower Susquehanna River Watershed Assessment Bed Change After the 2008 – 2011 Simulation