Download
1 / 24
240 likes | 375 Vues
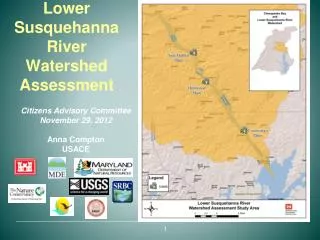
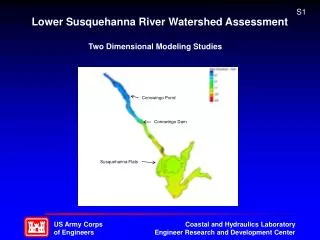
S1. Lower Susquehanna River Watershed Assessment. Two Dimensional Modeling Studies. Conowingo Pond. Conowingo Dam. Susquehanna Flats. S2. Lower Susquehanna River Watershed Assessment. Progress to Date: Task 1 – Evaluated Reservoir Sedimentation 3D Effects

E N D
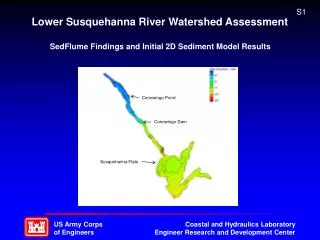
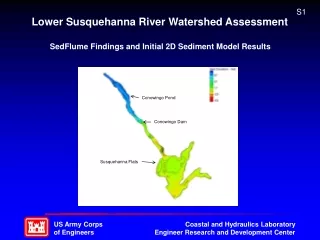
S1 Lower Susquehanna River Watershed Assessment Two Dimensional Modeling Studies Conowingo Pond Conowingo Dam Susquehanna Flats
S2 Lower Susquehanna River Watershed Assessment • Progress to Date: • Task 1 – Evaluated Reservoir Sedimentation 3D Effects • Task 2 – Built a 2D model of Conowingo Pond Including • Hydrodynamic Simulations • Task 3 – Built a 2D model of Susquehanna Flats Including • Hydrodynamic Simulations
S3 Lower Susquehanna River Watershed Assessment TASK 1 – Investigate Impacts of 3D Phenomena • What are the 3D Effects in Reservoirs? • Currents Generated by Density Gradients due to Temperature • Stratification • Currents Generated by Winds • Reservoir Discharge at Depth
S4 Lower Susquehanna River Watershed Assessment TASK 1 – Investigate Impacts of 3D Phenomena • When are These Effects Important? • Low River Discharge into Reservoir • Advection (Flow Velocity) is low; Turbulence and Mixing • at a Minimum • High Water Residence Time in Reservoir
S5 Lower Susquehanna River Watershed Assessment TASK 1 – Investigate Impacts of 3D Phenomena The Concern: Will 3D Effects Significantly Impact 2D Sediment Transport and Fate Simulations? The Approach: Evaluate Sediment Availability to Reservoir When 3D Impacts May be Significant
S6 Lower Susquehanna River Watershed Assessment Water Retention Time In Conowingo Pond * Flows > 30,000 cfs have a retention time of 5 days or less * ASSUME all Flows < 30,000 cfs Have Dominant 3D Effects * ASSUME all Flows > 30,000 cfs Have Sufficient Mixing
S7 Lower Susquehanna River Watershed Assessment Rouse Number Calculation to Predict Mixing / Stratification Medium Silt at 30,000 cfs R = Up / k(tB / r)0.5 Ratio of particle fall velocity To Bed Shear Stress Ratio of Gravitational Force that encourages settling to bed shear forces that encourage re-suspension Transport Mode Rouse Number Bed Load > 2.5 50% Suspended 1.2 – 2.5 100% Suspended 0.8 – 1.2 Wash Load < 0.8
S8 Lower Susquehanna River Watershed Assessment Flow Duration Curve for Susquehanna River Median Flow is about 26,000 cfs 56% of Flows are Less Than 30,000 cfs
S9 Lower Susquehanna River Watershed Assessment Sediment Rating Curve for Susquehanna River Sediment Load Entering the Reservoir in Tons / Day for a Given Discharge
S10 Lower Susquehanna River Watershed Assessment Integration of the Flow Duration Curve and Sediment Rating Curve Total Load / Year: 4,283,166 Tons Total Load < 30,000 cfs: 224,869 Tons BOTTOM LINE: Reservoir is Exposed to only 5% of Total Yearly Load During Low Flow Conditions Although 3D Effects do Occur, They Are Negligible
S11 Lower Susquehanna River Watershed Assessment 2D Model Development – Conowingo Pond AdH Numerical Mesh Info 21,893 Elements 11,432 Nodes Power plant and Flood Gate Discharge Capability
S12 Lower Susquehanna River Watershed Assessment 2D Model Development – 2008 Bathymetry
S13 Lower Susquehanna River Watershed Assessment 2D Model Development – Power Plant and Gates Floodgates Power Plant
S14 Lower Susquehanna River Watershed Assessment Susquehanna River Return Flood Flows Simulated 700,000 cfs Flood ~ 40 Year Return Event
S15 Lower Susquehanna River Watershed Assessment Water Depth at 700,000 cfs
S16 Lower Susquehanna River Watershed Assessment Velocity at 700,000 cfs
S17 Lower Susquehanna River Watershed Assessment Discharge Through Power Plant < 86,000 cfs
S18 Lower Susquehanna River Watershed Assessment Discharge Through Flood Gates > 400,000 cfs
S19 Lower Susquehanna River Watershed Assessment Post-Spill Site Overview
S20 Lower Susquehanna River Watershed Assessment 2D Model Development – Susquehanna River Through Susquehanna Flats AdH Numerical Mesh Info 16,357 Elements 8,587 Nodes
S21 Lower Susquehanna River Watershed Assessment 2D Model Development – Model Bathymetry
S22 Lower Susquehanna River Watershed Assessment Water Depth at 100,000 cfs Mean Low Lower Water Tail Water Elevation
S23 Lower Susquehanna River Watershed Assessment Velocity at 100,000 cfs Mean Low Lower Water Tail Water Elevation
S24 Lower Susquehanna River Watershed Assessment Velocity at 100,000 cfs Flow Patterns with Submerged Vegetation Roughness Assignment