Understanding Statistics: Sample Size, Distribution, and P-Values in Data Analysis
This article delves into the fundamentals of statistics, focusing on key concepts such as average, sample size, and distribution. It discusses the importance of using adequate sample sizes when analyzing data and the implications of P-values in determining statistical significance. Additionally, the piece humorously critiques the misuse of pie charts in presenting data without proper context. Through relatable examples, such as measurements in acres, carats, and barleycorns, the article highlights common pitfalls in statistical interpretations and emphasizes the need for rigorous analysis in drawing valid conclusions.

Understanding Statistics: Sample Size, Distribution, and P-Values in Data Analysis
E N D
Presentation Transcript
Statistically Speaking BIM- August 2012
Barleycorn 1/3rd of an inch
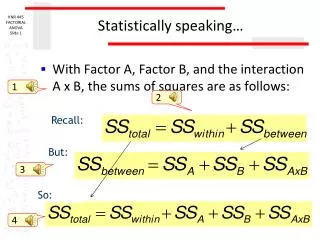
AVERAGE • SAMPLE SIZE • DISTRIBUTION
Why does Kyra mock pie-charts? • No sample size • No distribution • No p-values