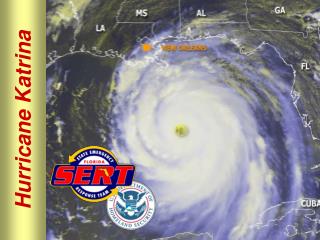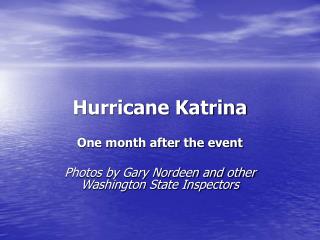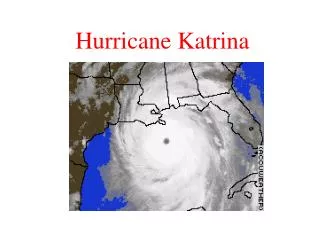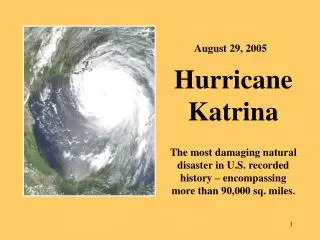
Hurricane Katrina
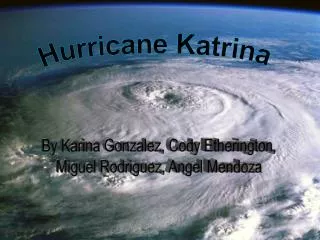
Hurricane Katrina. Presented by: Meredith Aronson, Tyler Evans, Margaret Hunziker , Karyn King and Rachel Frenkil. What Is A Hurricane? . A hurricane is a strong tropical cyclone over the Atlantic or Eastern Pacific Oceans in which sustained winds speeds reach 64 knots.


Hurricane Katrina
E N D
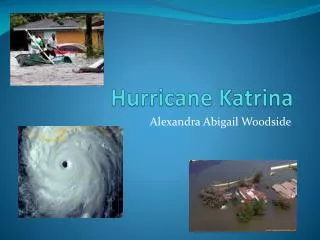
Presentation Transcript
Hurricane Katrina Presented by: Meredith Aronson, Tyler Evans, Margaret Hunziker, Karyn King and Rachel Frenkil
What Is A Hurricane? • A hurricane is a strong tropical cyclone over the Atlantic or Eastern Pacific Oceans in which sustained winds speeds reach 64 knots. • Western Pacific: typhoons • Indian Ocean: cyclones
Trigger Mechanisms for Thunderstorms: Hadley Cells Intertropical Convergence Zone
Trigger Mechanisms for Thunderstorms: Easterly Winds/ Mid-latitude Origin
Surface Conditions • Ocean water must be warmer than 26.5 degrees C (81°F) and the warm layer has to be at least 60 m(200ft) deep. • Heat and moisture from warm water is source of energy for hurricanes. • Hurricanes weaken rapidly over land or colder ocean waters. • Strong surface winds http://www.osdpd.noaa.gov/PSB/EPS/SST/data/global100.c.gif
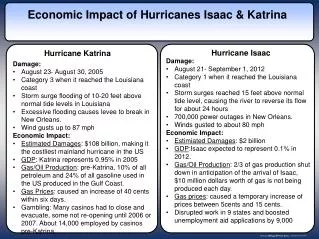
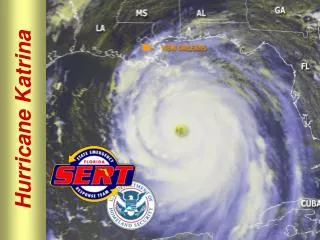
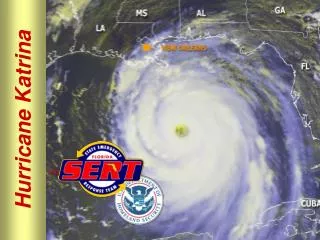
Surface Conditions During Hurricane Katrina • Average Sea surface temperature in the Gulf Coast exceeded 30°C. • Wind gusts in MS and LA exceeded 120 mph. • At its peak, the storm’s sea level pressure was 902 mb. • To put this into perspective, the lowest surface pressure ever recorded is 870 mb http://www.nasa.gov/centers/goddard/images/content/148071main_Katrina_SSHeights.jpg
Hurricane Structure: Eye The calm, circular center of a hurricane. Winds blow in a counterclockwise spiral around the eye. • About 20-40 miles wide • Relatively calm • Little to no rain • Often has low-level clouds called “scud clouds” • Warmest part of the storm (due to the descending air) • Strongest winds are to the right of the eye
Hurricane Structure: Eye Wall • A wall of thunderstorms surrounding the eye • Strongest winds and most rain • Changes in structure of eye and eyewall influence the storm’s severity
Hurricane Structure: Spiral Rainbands • Long bands of rainclouds that appear to spiral inward toward the eye • Outer rainbands can extend hundreds of miles from center • Can be obscured by higher level clouds, making it difficult for forecasters to monitor the storm
Hurricane Structure: How a Hurricane Travels • Rotates counter-clockwise at wind speeds of at least 74 mph • Travels across land at a slower pace, 10-25 mph
Development of a Hurricane:Necessary Upper-Level Conditions • 5 degrees north of equator so Coriolis force can be stronger • Weak vertical wind shear • If warm air is displaced, no eye • Hurricanes’ energy and latent heat • Low vertical wind shear allows for thunderstorms to develop
Air in the Lower Levels • Surface winds move heat and moisture from the ocean to the atmosphere • Air above the surface is destabilized and develops into thunderstorms • Strong surface winds maintain this process throughout the storm
Air in Upper Levels: the Eye • Air descends within the eye from the stratosphere to 1.5-2 km above the surface • Air within eye is warmer • Hurricanes are often called “warm core systems” • Boundary of eye (dry air) & eye wall (cloudy air) evaporative cooling, air descends more rapidly
Air in Upper Levels: Eye Wall • Air ascends from surface to tropopause • Enters eye wall at base and spirals inward toward the eye • Small amounts enter from the eye
Tracking Hurricanes Projected path Actual path
Hurricane Paths • The path of a hurricane depends on the area that it originates in. Hurricanes are greatly affected by the global wind pattern, the global wind pattern is broken up into three wind belts in each hemisphere. • WIND BELTS: • Polar Easterlies • Prevailing Westerlies • Tropical Easterlies
A hurricane originating in the eastern tropical Atlantic is driven westward by easterly trade winds from the tropics. These storms turn northwestward around subtropical high and move into higher latitudes. For this reason, the Gulf of Mexico and the East Coast of the United States have higher chances of experiencing hurricanes each year. Gulf of mexico
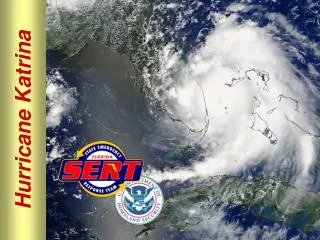
Aug. 25th, 2005 12:30 pm Aug. 24th, 2005 11:50 am
Aug. 27th, 2005 10:42 am Aug. 28th, 2005 8:42 am
KEY: Tropical Depression Tropical Storm Category 1 Category 2 Category 3 Category 4 Category 5
KEY: Tropical Depression Tropical Storm Category 1 Category 2 Category 3 Category 4 Category 5
Storm Surge • Abnormal rise in sea level offshore when a hurricane approaches the shore • Low pressure and persistent wind • Most powerful over shallow areas of water, near the coast or in bays and inlets • Occurs in front right quadrant of cyclone • Most destructive at high tide
Mechanics of Storm Surge • Wind • Ekman Spiral • Pressure • In the eye of the hurricane • Waves • Transport water near the shore
Mechanics of Storm Surge • Rainfall • Additional water in estuaries • Earth’s Rotation • Coriolis Effect
Forecasting Storm Surge • SLOSH (Sea, Lake, and Overland Surges from Hurricanes): model used to simulate surges from hurricanes. • Uses pressure, size, motion, track and winds to forecast surges • Accurate to within 20%
Measuring Storm Surge • Measure the difference between the forecasted tide and the amount of risen water observed • Pressure transducers along the coastline record the height of water overhead if submerged • Tidal predictions
Storm Surge Reporting • After a flood, surveyors map out High Water Marks (HWM) using photos and written descriptions. • If the water height cant be broken down and the water from the surge can be defined, then it is classified as a storm surge. • If not, classified as a storm tide.
Storm Tide • Water level made higher by a storm surge as well as the astrological tides. • Occurs at the zenith of the storm surge
Storm Surge in Hurricane Katrina • Flooding from the storm surge caused: • Beach erosion • Obliterated the Chandeleur Islands • Caused 53 levee breaches • Submerged 80% of the city
Storm Surge Flooding "I do not think anyone can tell you with confidence right now whether the levees will be topped or not [by storm surge] , but that's obviously a very, very great concern.”
Katrina’s Destruction • Katrina was not the deadliest hurricane because of increases in technology and communication. • The deadliest Atlantic hurricane occurred in 1780. • However, it was the costliest hurricane in the US since 1900. • Estimated damage costs for the US was $81,200,000,000.