Download
1 / 30
300 likes | 434 Vues
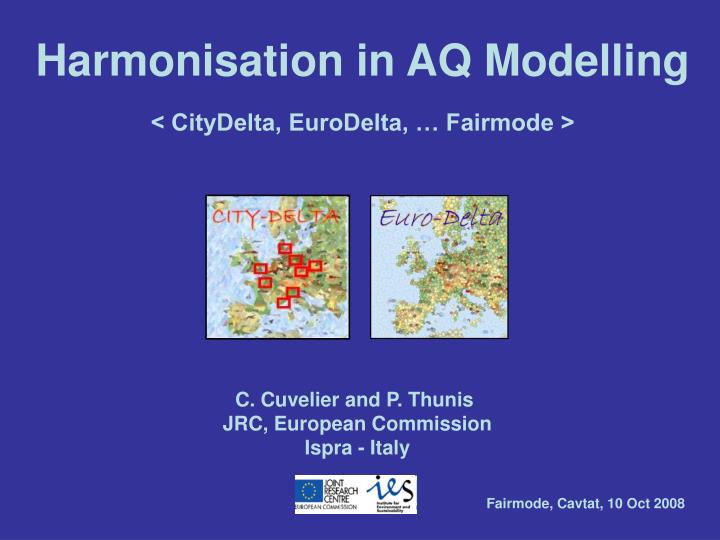
Harmonisation in AQ Modelling < CityDelta, EuroDelta, … Fairmode >. C. Cuvelier and P. Thunis JRC, European Commission Ispra - Italy. Fairmode, Cavtat, 10 Oct 2008. Overview. Harmonisation, support to AQ policy CityDelta project Objectives, Methodology EuroDelta project

E N D
Harmonisation in AQ Modelling < CityDelta, EuroDelta, … Fairmode > C. Cuvelier and P. Thunis JRC, European Commission Ispra - Italy Fairmode, Cavtat, 10 Oct 2008
Overview • Harmonisation, support to AQ policy • CityDelta project • Objectives, Methodology • EuroDelta project • Objectives, Methodology
Need for Harmonisation • Need for Evaluation of the uncertainty in AQ modelling used for AQ policy (see Directive AAQ). • Is there a (consistent) difference between the fine scale (FS, 5km) and the large scale (LS, 50km) models? • Do AQ models produce consistent responses to emission-reduction policy scenarios; What are the ranges of these responses ? • What is the robustness of AQ modelling • results in the policy context?
Harmonisation as we see it • Analysis of individual Modelling results (Validation against Obs) • Intercomparison of Modelling results • Ensemble approach (mean/median of the Models) • Analysis of the variability around the Ensemble • Validation of the Ensemble model • Spin-off: improvement and further development of models The Ensemble model is a useful tool in the frame of the Harmonisation of the individual model results. It is often more robust and looks therefore more appropriate for policy purpose
Policy context: Clean Air For Europe (CAFE) Launched in 2001 by the European Commission, CAFE was a programme of technical analysis aiming at the development of a long-term, integrated policy advice to protect against negative effects of air pollution on human health and the environment. Resulting in the Thematic Strategy published Sept 05 Question: Which measures will lead to a cost-effective reduction of air-pollution health-related problems in European Cities? In particular for O3 and PM CityDelta Objective: How to include sub-grid effects into a Europe-wide health impact assessment for PM/Ozone?
The JRC has coordinated: • A model inter-comparison exercise for urban-regional scale dispersion models focusing on 8 European cities to identify: • the systematic differences (delta’s) between rural and urban background AQ (“Scale”), • how these delta’s depend on emissions (“Emissions”), • how these delta’s vary across cities (“Cities”), • how these delta’s vary across models (“Models”) • how these delta’s vary for PM and O3 (“Pollutants”).
Driving force: WHO Review of health impact from air pollution • Damage from long-term exposure to PM2.5/PM10 • Not yet possible to distinguish potency of individual PM components • No threshold value for health impact can be identified • The levels of long-term mean concentrations are more important than (episodic) peak concentrations • CityDelta - Indicator: Annual mean PM2.5/PM10 (W/S) • New evidence for mortality effects from ozone • No firm evidence for no-effect level; but larger uncertainties for effects at low concentrations • Thus also low ozone days are relevan • CityDelta - Indicator: SOMO35 (*) (*) Sum of exceedances over 35 ppb of the maximum of the daily 8-hour mean O3 concentrations, calculated over the entire year
15 Modelling teams: 7 regional-scale 11 urban-scale
8 Cities: London Paris Prague Berlin Copenhagen Katowice Milan Marseille
8 Emission Scenarios • 0 --- 1999 • 1 --- 2010 CLE: Current Legislation • 2 --- 2010 NOx MFR: Maximum Feasible Reduction • 3 --- 2010 NOx (CLE+MFR)/2 • 4 --- 2010 VOC MFR • 5 --- 2010 NOX and VOC MFR • 6 --- 2010 PMcoarse MFR • 7 --- 2010 PM2.5 MFR • Meteo:1999 provided by Meteo-France (Aladin 10 km) or calculated. • Boundary conditions: provided by EMEP or calculated. • Long term simulations: full year for PM, 6 months for O3 • Outputs delivered with resolution of 5-10 or 50 km
Emission Inventories: Local vs Regional • NOx, CO, SOx estimates seems quite robust • PM estimates show 40-50% differences. • CityDelta has also contributed to a considerable revision of the regional-scale (EMEP) emission data
Corr. Bias CRMSE RMSE K.E.Taylor, 2001, JGR, 106, 7183-7192 • Model Validation:- The “Taylor” plots • - The “Ensemble” model O3
PM10 Winter BER MIL PRA PAR “Delta” Interpretation (City-Model) O3 Summer Mean BER MIL LON KAT PRA PAR Fine scale Ensemble Large scale Ensemble
“Delta” Interpretation (Emission-Scale) NOx Reduction CLE-2000 VOC Reduction SOMO35: (CityDomain) Fine scale Ensemble Large scale Ensemble
“Delta” Interpretation (Emission-Scale) NOx Reduction PM10: (CityDomain) CLE-2000 VOC Reduction Fine scale Ensemble Large scale Ensemble
Discussion • A first approach for addressing urban air quality for Europe-wide health impact assessment has been developed and implemented – based on observations and City-Delta results • Urgent need for validation of the FR with monitoring data, hampered by lack of PM2.5 sites. • Presently, grid average wind speeds used. No consideration of topography. City-specific wind speeds should improve. • Which emission/population density is representative of a city (how to draw city borders)? This determines directly the size of the urban increment.
Publications:Overview:Cuvelier,Thunis, Vautard, et al.Validation: Vautard, Thunis, Cuvelier, Builtjes, et al.Delta’s: Thunis, Rouïl, Cuvelier, et al.Emissions: Maffeis, et al.All: Atmos. Env.
Project to evaluate uncertainty in SRRs used in AQ policy • 5 regional models: EMEP, MATCH, REM3, CHIMERE, LOTOS • 28 emission scenarios (2000, 2010, 2020) with area specific reductions (FR, GE, IT, NorthSea, MedSea) • 60 sectoral emission reductions (2010, 2020) in FR, SP, • GE, UK, and MedSea • Zoom studies for Marseille, and Athens (50km => 10 km) • Use of the ENSEMBLE approach • Objectives : - Source-receptor variability • - Spatial variability • - Meteorological variability • - Confidence limits for policy purposes
Countries Mean Ozone BaseCase: Emissions 2000, Meteo 1999 • Differences between model results of about 10 ppb in the rural areas and over the countries ; largest differences in winter • Model variabiliy of 10 ppb represents about 40% of the ensemble value • Models are closer in highly populated areas and more different in rural areas and over the seas max ensemble min
Main Publications:Validation:in Atm. Env.Delta’s:Report EuroDelta I (to appear) Report EuroDelta II (Sep 2008)
http://aqm.jrc.it/citydelta DVD available with Results http://aqm.jrc.it/eurodelta Report + DVD available with Results
Need for Harmonisation • Need for Evaluation of the uncertainty in AQ modelling used for AQ policy. • Do AQ models produce consistent responses to emission-reduction policy scenarios; What are the ranges of these responses ? • What is the robustness of AQ modelling • results in the policy context?
Harmonisation as we see it(and as Fairmode may see it) • Analysis of individual Modelling results (Validation against Obs) • Intercomparison of Modelling results • Ensemble approach (mean/median of the Models) • Analysis of the variability around the Ensemble • Validation of the Ensemble model • Spin-off: improvement and further development of models The Ensemble model is a useful tool in the frame of the Harmonisation of the individual model results. It is often more robust and looks therefore more appropriate for policy purpose
OBSERVATIONS (surface, profiles, plane, lidar… MODEL 1 MODEL 2 MODEL 3, … 4-D Fields: Meteo, Chemistry, Aerosols Pre-processing (Window Interface) ASCII-BIN CDF MONIT Observation Overview SHOWALL 4D model data analysis XZ, YZ, SZ, XY Sections Comparison with obs. VALID Statistical Module Multi-models (obs .vs. models)
Station raw data Station Overview MONIT