Using Zip Code Data in Community College Enrollment Analysis
Using Zip Code Data in Community College Enrollment Analysis. AIR 2005, San Diego Willard Hom, System Office, CCC Terrence Willett, Gavilan College. Preface. The System Office, CCC, has the zip code of residence for every student who attends a California community college.

Using Zip Code Data in Community College Enrollment Analysis
E N D
Presentation Transcript
Using Zip Code Data in Community College Enrollment Analysis AIR 2005, San Diego Willard Hom, System Office, CCC Terrence Willett, Gavilan College
Preface • The System Office, CCC, has the zip code of residence for every student who attends a California community college. • A community college/district may request a data file on students, according to a specified set of zip codes. • We present an application of such zip code data that can help local planning efforts.
Analytical Uses of Zip Code Data • Definition of politically defined service population. • Estimation of “inflow”---students from areas outside the district’s designated area. • Estimation of “outflow”—students who reside in the district’s area but who attend a different CC district.
Politically Defined Service Population • District’s base population for indicators of performance and equity (i.e., participation rates). • District’s political basis for local funding. • District’s basis for state budgeting.
Inflow and Outflow implications • Inflow may indicate: • Strengths in a district • Perceived or actual high quality programs, services, facilities • Draw with distance learning • Relative competitive weaknesses in “sending” areas • Multi-area routine due to traffic patterns • Outflow may indicate: • Room for improvement in a district • Perceived or actual low quality of programs, services, facilities • Relative competitive strengths in “sending” areas • Multi-area routine due to traffic patterns
Cross-sectional Analysis • Gives snapshot of a district’s market. • Need measurement of variables at only one point in time (less demanding than panel analysis). • Can be a first phase of a panel analysis.
Cross-sectional Outcome Groups Movers = High Concern Stayers = Less Concern Concurrent = Some Concern
Panel Analysis • Do students transition to movers in stages, going from stayer, or concurrent, to mover? • Can capture the “effect” of an event to some extent (depending on confounding factors). • Is necessary for noting any trend. • Demands more inputs (and time) than cross-sectional analysis. • Can be an extension of an old cross-sectional analysis.
Panel Analysis Outcome Groups Each additional time period is another dimension.
Decision Factors for Outflow (or Inflow) • Multi-area lifestyle (i.e., commute to work). • Other travel factors (time, cost, ease, safety, etc.) • Curriculum differences. • Special activities (i.e. athletics) • Perception of transfer opportunity. • Distance learning options. • Perceived differences in campus climate/culture.
Reasons to Test the Forces for Flow (In or Out) • To identify areas where a district may improve its service/product. • To identify areas where a district may need to change students’ perceptions. • To identify situations where the costs of remediation are excessive or futile.
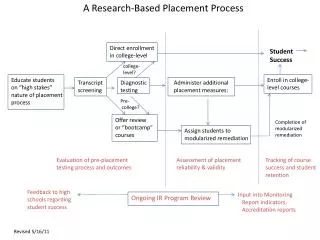
The Descriptive-Explanatory Continuum logistic regression/CART 2-way c/s tabs DescriptiveHow many stay or go? ExplanatoryWhy do they stay or go? 1-way tabs n-way panel tabs
Basic Model of Enrollment Choice student values Attend District CC (or not) Stay in district or leave district student perceptions actual conditions
Overall Strategy for Change program change conditions student choice marketing perceptions
Gavilan College Main Campus and its Anitpodal Point Gavilan College Main Campus ^ _ Gavilan Antipodal Point ^ _ µ 0 7,500 15,000 30,000 Kilometers Gavilan Research Office 2004
Orick ! ( Sacramento ! ( San Francisco ! ( Mariposa ! ( Santa Cruz _ ^ ! ( Gavilan College Amboy ! ( Los Angeles ! ( San Diego ! (
Univariate Ginsu • In general, it appears that students who live in our district but go to community colleges elsewhere are: • more likely to live closer to San Jose • of a similar age distribution to those who come to Gavilan except leavers have relatively fewer members over 60 • more likely to be male and non-Hispanic • more likely to have a high school diploma or an AA (those with no diploma or a BA or higher are more likely to come to Gavilan) • less likely to take as many units • more likely to be enrolled in vocational type programs that are mostly not transferable.
Modeling Flow • Time (3 successive Fall terms) • Latitude • TOP code • Term length (short vs. full term) • Course Units • Degree Applicability • Transferability • Basic Skills Status • Meeting Days • Age • Gender • Ethnicity • Success • Cumulative Units Attempted (student experience) • Educational Level
Logistic Regression • Entered all variables with no interactions except meeting days due to large amount of missing data • Only time not significant • Findings seemed to reinforce univariates • Risk = .175 (guessing = .25 in this case), Hosmer and Lemeshow < 0.0005, Cox & Snell R-square = 0.228, Nagelkerke R-square = 0.343, n = 123,882
CART • In general, those taking non-transferable vocational courses were more likely to attend another college. • If taking general education/transfer courses those: • north of Morgan Hill very likely to attend another college • south of Morgan Hill very likely to attend Gavilan • Those in the Morgan Hill area very likely to attend Gavilan if: • TOP code was Biological Sciences, Business and Management, Information Technology, Fine and Applied Arts, Commercial Services, or Interdisciplinary Studies (basic skills and tutoring) OR • TOP code was Media and Communication, Education, Foreign Language, Health, Family and Consumer Sciences, Humanities, Mathematics, Physical Sciences, Psychology, or Social Sciences AND those courses were degree applicable (otherwise attend elsewhere) • Risk = .16, n = 147,139
Next Steps • Have faculty and administration assist with interpretation in the context of the possible • Use data to create “competitive” strategies to improve our programs, services, and image • More Data!!! • Obtain more relevant variables • Conduct improved survey of out flowers • Continue to track flow • Improve statistical models
Limited Domain of Comparison • In comparing student movers or stayers within the CCC system, we miss two sources of “leakage” that could inform strategy • Providers outside of the CCC system • Students who drop out because of unmet needs at a district but who cannot find an alternative.
Zip Code Limitations • Reliability of data must be checked. • Zip codes are relevant for entities with clear borders—only true of districts and of single-college districts. • They serve as an “auxiliary” variable; other variables are needed to draw meaningful conclusions. • Distance learning changes traditional view.
Willard Hom whom@cccco.edu (916) 327-5887System Office, California Community Colleges1102 Q St.Sacramento, CA 95815-6511 Terrence Willett twillett@gavilan.edu (408) 848-4852Gavilan Community College 5055 Santa Teresa BlvdGilroy, CA 95020 Contact Information