Download
1 / 23
240 likes | 390 Vues
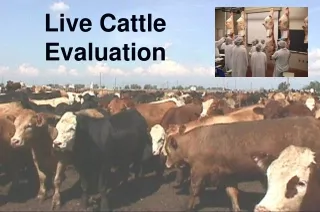
Live Animal Evaluation Beef. Fat Indicators. Tailhead & Pins. Last Ribs. Fore flank. Rear flank & Cod. Brisket. Steer 1. Steer 2. Comparison. Steer 1 - Choice. Steer 2 - Standard. Market Beef Muscle Indicators. Loin. Quarter/ Rump. Forearm. Stifle. Live Cattle Evaluation.

E N D
Fat Indicators Tailhead & Pins Last Ribs Fore flank Rear flank & Cod Brisket
Comparison Steer 1 - Choice Steer 2 - Standard
Market Beef Muscle Indicators Loin Quarter/ Rump Forearm Stifle
Live Cattle Evaluation • Live Weight • Dressing Percentage • 12th rib fat • Rib Eye Area • Kidney, Pelvic, Heart fat (KPH) • Breed Influence • Quality Grade • Yield Grade
Weight • Live or Carcass • Live Weight range • 900 lb to 1500 lb • Avg: 1250 lb • Carcass Weight range • 550 lb to 950 lb • 775 lb
Dressing Percentage • Proportion of live weight that ends up as carcass • Example: 1250 lb steer with a 775 lb carcass has a dressing percent of 62% • Range: 55 - 67% • Avg: 62%
Factors Affecting Dressing % • Gut Fill • Gut fill = Body Weight = Dressing % • Hide weight and/or mud • Hide wt = Dressing % • Muscle • Muscle = Dressing % • Fat • Fat = Dressing % • Dairy influence
12th Rib Fat • Highly correlated to retail yield • Predictor of total carcass fatness • Range: .15 in. to .80 in. • Avg: .40 • .25 in. considered minimum
Rib Eye Area • Highly correlated with lean yield • Predictor of total carcass muscle • Dependant of carcass weight • Range: 9.0 - 18.0 sq. in. • Avg: 12.5 sq. in. for 1150 lb steer • Rule of thumb: 1.1 sq. in. for 100 lb live wt
KPH • Internal fat as a percentage of carcass weight • Continental cattle will tend to have less than British cattle • Range: 1.0 - 4.5% • Avg: 2.5%
Breed Influence The use of genetic data has helped increase the animals ability to grade, however not all breeds grade equally. • English Breeds: most consistent • Continental: tend to lack marbling, bad attitudes stress out marbling • Brahman: thicker hide; tend to be low marbling, decreased dressing % • Dairy: tend to be lean, but marble well
Quality Grade • Assigned according to amount of marbling and bone maturity • Most influential component of pricing • Range: Standard to Prime • Avg: Low Choice
Factors Affecting Quality Grade • Genetics • Age of cattle • Time on feed • Energy content of diet • Fat cover • Continental/ Brahman influence
Yield Grade • Calculated to predict yield of boneless, closely trimmed, retail cuts from the round, loin, rib and chuck (BCTRC) • Based on 4 estimations • 12th rib fat • Hot carcass weight (HCW) • Rib eye area (REA) • Kidney, pelvic, heart fat (KPH)
Yield Grade • Range: 1 through 5 • 1 = Lean and/or Muscular; High cutability • 5 = Fat and/or Light Muscled; Low cutability • Avg: 3.0
Official Placing • Class 1: Angus SteersCuts: 2-3-2 • Official Placing: 2-4-3-1