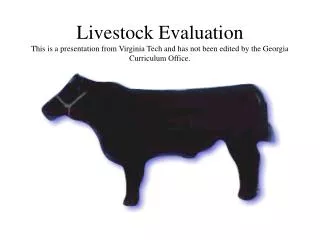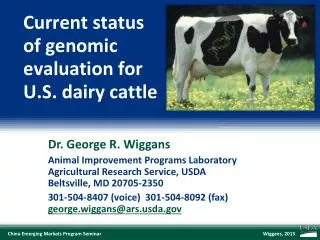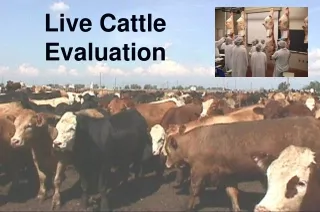
Live Cattle Evaluation
This article delves into the critical aspects of live cattle evaluation, focusing on quality grade, yield grade, and dressing percentage. It elucidates the factors determining quality grades, including maturity and marbling, detailing how physiological age affects beef grading. Additionally, it examines yield grades, emphasizing the impact of fat and ribeye area on cutability. The importance of dressing percentage in the livestock marketing landscape is also discussed, highlighting key factors that influence this metric. Learn how these elements shape the value of beef products in the industry.


Live Cattle Evaluation
E N D
Presentation Transcript
What are we trying to determine? • Quality grade • Yield grade • Dressing percentage
Quality Grade Factors Maturity Marbling
Beef Quality Grading Factors-- Maturity -- • Estimation of physiological age • Classifications: A B C D E (young to old) • determined by degree of bone ossification • most fed cattle = A maturity (< 30 mo of age) • As age , QG
Bone Maturity Thoracic Cartilagenous Vertebrae
Bone Maturity Thoracic Cartilagenous Vertebrae
A B C D E 96 30 72 42 Feedlot Cattle Young Cows Older Cows Chronological Age of Cattle Heiferettes
Beef Quality Grading Factors-- Marbling -- • Measure of the intramuscular fat • fat within the muscle • “taste” fat
B C D E A PRIME Sl. Abundant Moderate COMMERCIAL CHOICE Modest Small Slight SELECT UTILITY Traces STANDARD CUTTER Practically Devoid
Measure of cutability or the percent yieldof boneless, closely trimmedretail cuts from the: chuck rib loin round Wholesale Cuts from the Beef Carcass Beef Yield Grades
Interconversion of YG and the % of Boneless, Closely Trimmed Retail Cuts % lean (muscle), % fat % lean (muscle), % fat
Factors Used to Calculate Beef Yield Grades • Fat over ribeye (in) FOE • % kidney, pelvic, heart fat KPH • of the carcass weight • Ribeye Area (in2) REA • Hot carcass weight HCW As HCW , REA must
Measurement of FOE 3/4 length of Ribeye Fat thickness
Dressing Percentage • Used as a basis for marketing livestock • beef • Usage and importance as the industry moves toward “value-based” marketing. • As fat , dressing percentage • but YG less desirable (poor cutability)
= hot carcass weight live pay weight 100 1200 100 = 62.5% 750 cattle Dressing Percentage Example: If live weight = 1200 lbs HCW = 750 lbs
1200 X .65 = 780 lb HCW Dressing Percentage Example: If live weight = 1200 lbs DP = 65%
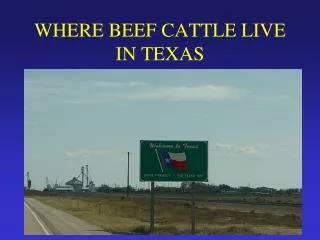
Beef Dressing Percent • Fed Cattle = 63% • Cows = 50% • Factors that affect dressing percentage • “Fill” -- large rumen capacity • fat cover -- fat animals have higher dress • mud on the hide -- add live weight, reduce dress
Key Points: The Beef Industry Carcass Evaluation of Beef • Beef quality grading factors (2) • associated quality grades • Beef yield grading factors (4) • associated yield grades • Dressing Percent • factors • importance for valuation of beef
How do we value our customers? High Low