Introduction to Live Animal Evaluation
540 likes | 780 Vues
Introduction to Live Animal Evaluation. Kenneth Geuns Michigan State University Dept. of Animal Science. Introduction to Market Beef Evaluation. Market Beef Evaluation: Fat Indicators. Tailhead & Pins. Last Ribs. Fore flank. Rear flank & Cod. Brisket. Steer A. Steer B. Steer B.

Introduction to Live Animal Evaluation
E N D
Presentation Transcript
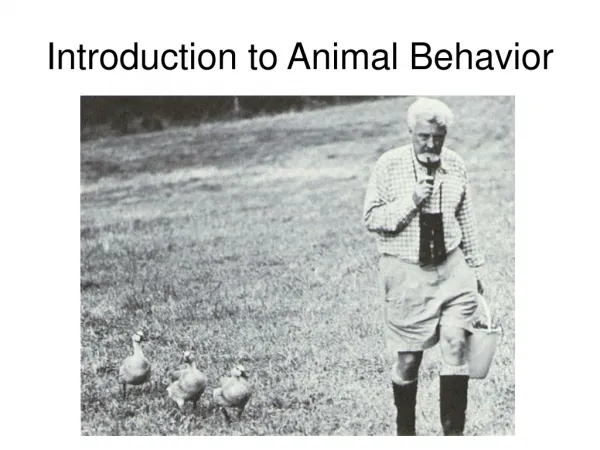
Introduction to Live Animal Evaluation Kenneth Geuns Michigan State University Dept. of Animal Science
Market Beef Evaluation:Fat Indicators Tailhead & Pins Last Ribs Fore flank Rear flank & Cod Brisket
Steer B Steer A
Market Beef Evaluation:Muscle Indicators Loin Quarter/ Rump Forearm Stifle
Live Cattle Evaluation • Weight • Dressing Percent • 12th rib fat • Ribeye area • KPH • Quality Grade • Yield Grade
Weight • Live or Carcass • Live Weight range • 900 lb to 1500 lb • Avg: 1200 lb • Carcass Weight range • 550 lb to 950 lb • 750 lb
Dressing Percent • Proportion of live weight that ends up as carcass • Example: 1250 lb steer with a 775 lb carcass has a dressing percent of 62% • Range: 55 - 67% • Avg: 62%
Factors Affecting Dressing % • Gut Fill • Gut fill = Body Weight = Dressing % • Hide weight and/or mud • Hide wt = Dressing % • Muscle • Muscle = Dressing % • Fat • Fat = Dressing % • Dairy influence
12th Rib Fat Thickness • Highly correlated to retail yield • Predictor of total carcass fatness • Range: .15 in. to .80 in. • Avg: .40 • .25 in. considered minimum
Ribeye Area • Highly correlated with lean yield • Predictor of total carcass muscle • Dependant of carcass weight • Range: 9.0 - 18.0 sq. in. • Avg: 12.5 sq. in. for 1150 lb steer • Rule of thumb: 1.1 sq. in. for 100 lb live wt
Kidney, Pelvic and Heart Fat • Internal fat as a percentage of carcass weight • Continental cattle will tend to have less than British cattle • Range: 1.0 - 4.5% • Avg: 2.5%
Quality Grade • Assigned according to amount of marbling and bone maturity • Most influential component of pricing • Range: Standard to Prime • Avg: Low Choice
Genetics Age of cattle Time on feed Energy content of diet Fat cover Continental/ Brahman influence Factors Affecting Marbling
Yield Grade • Calculated to predict yield of boneless, closely trimmed, retail cuts from the round, loin, rib and chuck • Based on 4 estimations • 12th rib fat • Hot carcass weight (HCW) • Rib eye area (REA) • Kidney, pelvic, heart fat (KPH)
Yield Grade • Range: 1 through 5 • 1 = Lean and/or Muscular; High cutability • 5 = Fat and/or Light Muscled; Low cutability • Avg: 3.0
Lamb Evaluation: Fat Indicators Shoulder Breast Flank Forerib
Lamb Evaluation: Fat Indicators Spine Loin Edge Dock Base of leg/ Twist
Lamb Evaluation: Muscle Indicators Leg Forearm Stifle
Lamb Evaluation: Muscle Indicators Rack Loin Leg
Live Lamb Evaluation • Weight • Dressing percent • 12th rib fat • Ribeye area • Yield grade • Quality grade
Weight • Live weight • Range: 90 - 150 lb • Avg: 125 lb • Carcass weight • Weight of dressed carcass with kidney and pelvic fat removed
Dressing Percent • Percentage of live weight that ends up as carcass • Range: 45 - 58% • Avg: • 53% for shorn lambs • 50% for unshorn lambs
Factors Affecting Dressing Percent of Lamb • Pelt weight • Unshorn lambs will dress 1-5% lower than shorn • Fill • Muscling • Fat cover
Fat Thickness • Taken at the 12th rib • Normally adjusted up to a .1 inch due to body wall fat • Used in YG equation • Range: .05 - .50 in. • Avg: .25 in. • Minimum requirement: .15 in.
Ribeye Area • Measured at 12th rib • Indicator of total muscle in carcass but not used in YG equation • Range: 1.5 - 4.5 sq. in. • Avg: 2.5 sq. in.
Yield Grade • Predicts the yield of boneless, closely trimmed retail cuts from the leg, loin, rib, and shoulder • Only includes adjusted 12th rib fat thickness • YG = 0.4 + (10 * Adj. fat thickness)
Quality Grade • Predictor of eating quality based on three factors: • Maturity • Lean Quality • Texture • Firmness • Marbling • Conformation
Lamb Quality Grades • Range: Good to Prime • Avg: Choice • Majority of market lambs will grade Choice
Lamb Quality Grade • Superior conformation can compensate for inferior lean quality and vice versa • Good lean quality with Choice conformation = Choice • Prime lean quality with Choice conformation = Prime • To qualify for Ch or Pr, lamb carcass must have at least .10 in. fat covering
Swine Evaluation: Fat Indicators Ham/ Loin Junction Loin Edge Shoulder Seam of Ham Elbow Pocket Flank Jowl
Swine Evaluation: Muscle Indicators Loin Forearm Ham Stifle
Weight • Live Weight • Range: 210 lb - 300 lb • Average: 250 to 260 lb • Carcass Weight • Weight of dressed carcass (hot or chilled) • Chilled 1.5% less than hot • Range: 150 - 215 lb • Avg: 180 lb
Dressing Percent • Proportion of body weight that ends up as carcass • Example: 255 lb live weight hog with 186 lb carcass = 73% dress • Some variation in dressing % across plants due to slaughter procedures and time of carcass weight measurement (hot or chilled) • Range: 65 - 77% • Avg: 72%
Factors Affecting Dressing Percent • Gut Fill • Gut fill = Body Weight = Dressing % • Muscle • Muscle = Dressing % • Fat • Fat = Dressing %
Carcass Length • Measurment taken from the First Rib to the Aitch Bone • Not in calculations • Range: 28 - 34 in. • Avg: 31 in.
10th Rib Fat • Used in % Muscle Formula • Range: .50 - 1.50 in. • Avg.: .90 in
Last Rib Fat • Used in USDA Grade calculation • Range: .40 - 1.40 in. • Avg: .80 in.
Loineye Area • Estimated at the 10th rib • Range: 3.8 - 9.0 sq. in. • Avg: 5.5
Reading Top Shape BF = .90 inches
Reading Top Shape BF = 1.5 inches